I like being a nice guy.
I like to encourage people and speak of the good things that they do. But when someone decides to publically oppose the truth, using falsehoods, while making increasingly condescending remarks, then there’s not much else I can do except publically rebuke them. When you take it upon yourself to oppose the truth with falsehoods, you will lose. And so….
A few days back, I posted some further X-rays from the CT scans of the Delk track on my official “Delk track” page. This was in response to a question by username “ftom2006” over at the Delk track video on youtube. [At the time of this writing there are well over 700 comments on the video – all the quotes here are buried in the comments there]
He had a good point which I felt should be addressed, basically stating that if the density gradients show that the lowest density in the rock revealed that it has the density of a jellyfish (for example), then there’s something wrong.
I wanted to be respectful to ftom, as at the time, he was being quite respectful. But his comments were also raising some concern – he seemed to know something about what he was talking about, but also made huge errors in his claims. His first big blunder was in trying to pass off the high-density area at the junction of the dinosaur toe and the human track as simply an artifact of beam hardening:
“Actually, there’s nothing special about the alleged 4 cm deep ‘high density’ point (07:40). Similar to the ends at the smaller sides of the rock, that’s an area of morphologic edges, and it shows a variation in brightness compared to the alleged ‘low density’ areas exactly as it has to happen due to beam hardening.”
Common sense would say that’s ridiculous, as this would completely invalidate CT technology: What’s the point of buying a bazillion dollar machine if it throws out random errors on the order of centimeters deep?
But to be sure, I asked not one, but two separate CT technicians about this, quoting ftom’s comment. They both said the same thing, almost verbatim: “….that’s…. just …. not possible!” They were both rather surprised at such a ridiculous suggestion.
I addressed this erroneous claim of beam hardening, and a whole wack of other claims on my official Delk track page.
Despite this ridiculous claim, I did feel his questions about density variations and sample measurements were quite reasonable and called for. I had to wait several days for the CT tech who actually carried out the scans on the Delk track, as he was out of his office for several days. Though I already had the full suite of X-rays from the Delk, including the ones with density sample sites, I had several technical questions that I wanted to ask the technician. After having a very enlightening conversation with him, I posted some of the highlights on my official Delk track page, as well as the X-ray scans which had the density sample sites on them.
Ftom then posted back a very long, technical, impressive sounding response that was sure to send the Delk track proponents scurrying! And consequently, he started getting a little lippy.
(note: I’m not going to sit here and nit-pick over spelling mistakes, etc… So don’t expect a [sic] at every single mistake – this is the internet, and I think people are allowed to make speeling mistakes in posts.):
Ftom wrote:
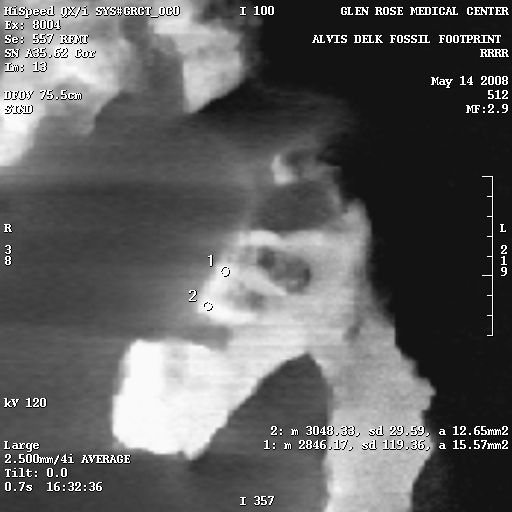
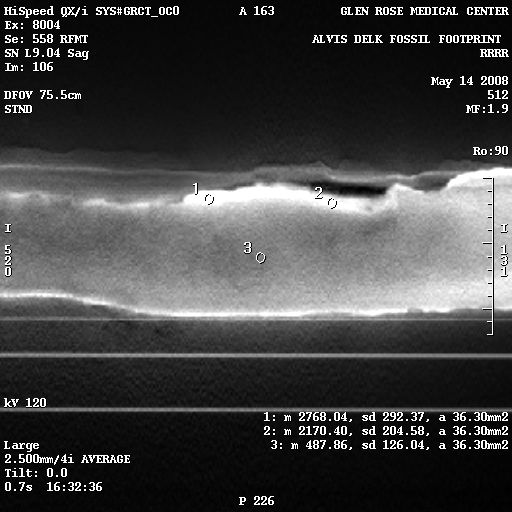
“[1] Well, since absolute density values are still missing: one does not really need to know the absolute density values to evaluate the scan results. If the inherent assumptions of the method, like detection of transmitted intensities, no scattered fraction, no beam hardening would be true, indeed, there would be an essentially linear relation between the Hounsfield number and the true density values.A minimum HU of 488 (Fig. 7e, #3) and a highest HU of 3048 (Fig. 7a, #2) are given for the rock on the ianjuby-Delk website. Both values are clearly distinct, since the internal precision (sd) of the HU determination reads about 1% for the highest, 5-10% for somewhat lower, and 25% for the lowest values. Whatever the absolute apparent density values, their difference translates to the fact that the minimum apparent density is only about 16% (=487*100/3048) of the maximum apparent density.
Let’s consider the consequences in case that the apparent density variations, as obtained from uncritical HU reading, would be mistaken to reflect true physical densities of the rock. The investigated sample appears to be some impure limestone, someone please correct me if I’m wrong. Accordingly, the rock is essentially composed of the mineral calcite (CaCO3). Calcite has a density of 2.71g/cm^3.
This value is the maximum physical density for a 100% dense, totally compacted limestone at room conditions, just as Delk proponents are about to sell for the rims of this slab.
Accordingly, the minimum apparent density corresponds to the value of 0.43g/cm^3. This is simply not a realistic density for this rock, not even remotely, not at all. The corresponding absurd rock would be a limestone composed of 84% porosity and 16% calcite floating in air. Adding some impurities like mica or quartz won’t change anything significant in this estimation.Prize question, therefore, which of the two is hollow and rattles if shaken: the Delk slab or the oversimplified notion that HU readings correspond to the physical density of this rock?”
Prize question indeed!
It’s at this point that I usually just sit and wait, to see if the skeptics are going to sink their ship just a little bit more, or start frantically bailing the boat and trying to patch the holes.
But wait – Glen Kuban (username “nabuk3” on youtube), apparently revelling in the “thorough debunking” of these sophisticated CT-scans, decided to jump on the ship as it was going down:
“ftom, Thank you for contributing your expertise and insights. To boil it all down… do I understand you correctly to say that in this case the print proponents were _not_ justified in assuming, as they seem to have done, that lighter areas = higher density = compaction?”
Ftom replied in a string of impressive sounding comments, based on his original analysis:
“Yes, nabuk, equation essentially _not_ justified. The estimates demonstrate that the apparent density differences are far too large to represent true density differences.”
“Starting with lower density of a more realistic, porous limestone (e.g. ~2.2 g/cm^3) would just worsen the situation, yield even more absurd, low density values for the core of this rock (~ 0.35 g/cm^3). In this case, the whole slab is likely to float in salt water. Turning the model around, starting with a realistic density assumption for a porous limestone in the core (~ 2.2 g/cm^3) would necessitate a density of ~ 13.8 g/cm^3 for the a rim of this slab, i.e a density higher than elemental iron (~7.9), somewhere between a bar of lead (~11.4) and native gold (~19.3 g/cm^3).
Inherent assumptions for X-ray CT density measurements had not been fulfilled in the case of this rock-shaped, rock-dense object. ”
It’ll float on water….?
Through a bunch of convoluted math and illogical reasoning, ftom used the Hounsfield numbers to “calculate” the density in the center of the rock. A Hounsfield unit of 487 in this case (figure 7e, sample 3). By his reckoning, the rock density at this sample point must be on the order of 0.43 g/cc (0.43 grams per cubic centimeter). And of course to come to that figure, he was being generous to us creationists. As he astutely pointed out, anything of this density will float.
It was Andrew Rodenbeck, a guy who knows nothing about CT scanning technology, who pointed out the first, most obvious error in ftom’s logic and calculations.
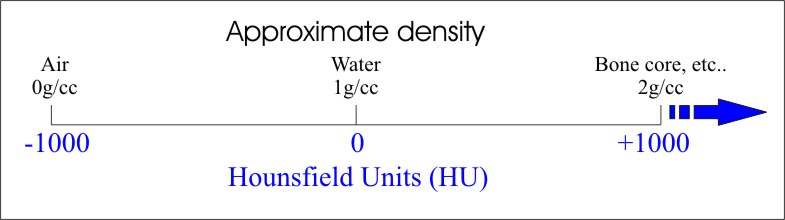
CT scanners produce Hounsfield numbers. The Hounsfield scale is based on water and air. Air is -1,000 (negative one thousand) on the scale, water is zero. As an example, bone can be anywhere from a few hundred to a few thousand Hounsfield units, depending on the bone and where the sample is taken. The CT scanners are calibrated to the density of water as their zero point.
Correct me if I’m wrong, but I believe that 487 is a higher number than zero. If a Hounsfield unit of zero is equal to the density of water, and water has a density of 1 g/cc, one does not have to be the head cashier at Walmart to realize that a Hounsfield number of 487 must represent a density much higher than 0.43 g/cc, as ftom claimed.
The third major blunder he pulled off relates to the second. In his words, “the minimum apparent density is only about 16% (=487*100/3048) of the maximum apparent density.”
The density “zero” point is -1000 Hounsfield units, not zero Hounsfield units. Ftom incorrectly attributed the entire density span of the rock to the 3048 positive Hounsfield units, instead of the full 4048 HU. So the minimum density is actually 37%, before any error margins are considered.
In fact, if ftom had stopped for a moment to think (more on this in a second), even without calibration on the CT scanner, there was lots of clues that he was in error.
For starters, one can get a pretty good handle on the density variations within the rock. For instance:
- We can give a very good guess-timate on the density of the rock, and therefore can get a pretty good handle on what density the highest HU value represents.
- We can then approximate densities using the Hounsfield numbers
- The lowest reading was clearly an outlier in the measurements
- Other sample readings of CT scans can be used as a gauge for density gradients within the Delk CT scans
- For the sake of our study, we are only concerned with sub-surface density variations
Sample measurements from other CT scans:
In all the fray, apparently ftom forgot the sample readings of selected Hounsfield numbers that I provided from various places on a random CT scan of a single patient, on the very same machine the Delk track was scanned on. I’ll repeat them here:
- Air inside a lung: -651 (note this is negative)
- Cortical bone: 172
- Liver: 33
- Rib center: 104
- Rib surface: 754
- Vertebrae: 195
It should be noted that these were select readings from a single patient, and not an average. The fact that 487 is considerably higher than most of the bone samples I provided should’ve been a clue to ftom that somethin’ wasn’t quite right in his equations. Bones sink in water, therefore their densities are higher than 1g/cc, and the reading of 487 was higher than the average bone density. Instead, apparently he forgot this in his “expert analysis.”
In fact, he questioned the sample reading I provided from Cortical bone. He was quite right in that this is one of the densest bones in the body… which is precisely the reason that the CT technician who gave me that number chose that location! I thought perhaps I had made a mistake in transcribing the number, but fortunately, I had recorded the conversation as it was the fastest way to take notes. Nope, there was no mistake.
This just goes to show you that a single, low-density reading is not the end of the matter. If we take the maximum error margin for figure 7e, point 3 (HU 614), that’s 40% of the maximum density – a far cry from ftom’s calculations, and is a discrepancy easily explained in a number of ways.
The Outlier:
This lowest Hounsfield number is very much an outlier in comparison to the other numbers. Indeed, it’s deviation (SD) can be +/- 126, or about 25%. In other words, the CT scanner figured the error margin for that number was on the order of 25%!
Clearly, if anything, the number is going to be higher, not lower – simple logic and comparison to the other samples make this obvious. If ftom wishes to disagree and make a fool of himself some more, he’s welcome to.
After all, ftom was very quick to point out the unexpected HU sample reading of the cortical bone that I provided. He immediately spotted it as an “outlier,” and promptly proceeded to replace the number I provided with a number he thought was more reasonable! He then accordingly re-evaluated all the Hounsfield units right across the board!
Now that would be hypocritical of ftom to then criticize me for saying that lowest HU is simply an outlier, wouldn’t it? Especially because – let’s face it – logic is on my side, and not the side of those who would argue that the rock is less dense than the HU’s imply.
As both the skeptics and myself have pointed out, the rock has many thin laminations and cracks. Thus, this one sampling, taken with a circle a mere 7 milimeters in diameter, may very well have landed on a crack or lamination, thus accounting for the lower HU reading.
No, I feel quite justified in claiming that the lowest Hounsfield number is no doubt higher than 614. This number is simply an outlier – the sample site probably landed on an internal crack or something, it is an anomaly.
We only care about sub-surface:
Of course, we are only interested in sub-surface density variations anyway – variations that occur within the first few centimeters of the rock. This is where all of the “action” is going to take place, and as one can see for themselves, we clearly see a lot of variation several centimeters deep into the rock. Thus, once again, the density variations are demonstrated as genuine.
Lastly, as I have already repeatedly said, the images that are displayed are rendered for maximum contrast. This is to make a good visualization of the very real density gradients in the rock. Density gradients which conveniently line up with two fossil footprints – that’s just a little too much coincidence.
Prize question, therefore: which of the two is hollow and rattles if shaken: the Delk slab, or ftom’s analysis of the CT scans of the Delk slab?
Ftom has apparently gone on to other ‘arguments’ about how the “air” looks as dense, or denser in the rock in the CT scan, yada yada yada… But… I don’t look too worried now, do I? You guys are smart – I think you’ll be able to figure out where he went wrong there too.
Why the major blunders?
Sadly, this is typical of anti-creationist writing. This is what I have to deal with all the time. Anti-creationist propaganda is typically very badly researched and written, often containing major logical and scientific blunders – even from experts and very intelligent people. While sometimes I have no doubt it’s deliberate deception, I do think that usually it is just honest mistakes – but why so many, and so often?
The reason is because the anti-creationists usually venture into nit-picking the evidence, trying to discredit it. As my good friend David Lines says, “They are looking at the eyelid of an elephant through a microscope. As a result, they can’t see the elephant that is about to crush them.”
All too often this nit-picking is to serve no other purpose than to obfuscate the evidence – distract people with so much nonsensical information and impressive-sounding arguments that people will simply not look at the evidence.
The elephant in the living room is obvious to anyone who looks at the Delk track: It is profound evidence that dinosaurs and humans lived together. Don’t let anybody distract you away from this very simple, observable fact.
Indeed, it would appear that we are *quite* justified in assuming that “lighter areas = higher density = compaction”
And by the way Glen Kuban – yes, I do still stand by what I said about the Limestone cowboy. But I’ll deal with that subject later on.


It is quite unfortunate that this incredible find sat for such a long period of time in his basement before being cleaned. Isn’t that unusual? It opened up the most criticism by those wanting to call it a “hoax”. I would appreciate a similar response to the following claim that the prints were manufactured.
https://pterosaurheresies.wordpress.com/2013/09/05/human-and-dinosaur-tracks-together-chimaeras-and-fakes-part-6/
All else aside, the very shape of the print is clearly not human.