by Ian Juby | Apr 20, 2015 | Science Notes
Just this past week, an article came out in Nature magazine relating to Panderichthys, a supposed “fishopod.” Bear with me – this is going to be confusing, but that’s not my fault!
If you recall, the evolutionary myth has fish evolving legs and walking up on land, becoming tetrapods (land walkers). Hence the nickname “fishopod” – it’s half-fish, half-tetrapod…. or so certain evolutionists would have you believe.
This week’s ruckus arises from a CT scan of the front fin of a Panderichthys fossil, seen on the right. (To familiarize yourself with CT scans, see the video on the Delk track.)
The purple bone at the top is the bone that anchors to the body, and the little brown bones at the tip are what’s causing all the fuss.
You see, previously, it was thought that the bones at the end of the fin (the two blue, the yellow, and five brown bones) were only two bones. It turns out there was actually six of them (as revealed by the CT scans), and the four small dark brown bones may be “four radials that hint at the future development of fingers.”
To see just how clear the mud is, we need to first take a crash course in fishopod evolution – work with me here!
Wikipedia nicely spells it out for us, in graphic form:
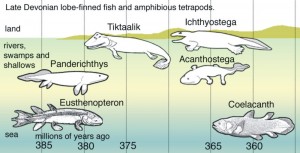
You can see the implied “evolutionary ascent” from fish to fishopod over time. Seeing as how all the fuss is over a fin, I’m going to focus just on the fins, timeline, and supposed evolution.
Let’s first ask the question “Why do they think these fossils show an evolutionary sequence?” The implied answer of course, is that these fossils show improvement and change from fish to tetrapod over time. But even just looking at the fins, the whole story just turns into another fish story real quick! While I don’t believe in these millions of years, and I don’t believe in these “radial bones,” I’m going to meet the evolutionary myth where it’s at and examine the interpretations. I’ll use a chart from Nature so you can see the “evidence” and claims yourself.:
Graphic from Nature magazine.

Eusthenopteron first appears 385 million years ago. It has six radial bones.
Panderichthys, first appearing 380 million years ago, is now believed to have four radial bones.
The Canadian fishopod, Tiktaalik, was found in 375 million year old rock. It’s not known how many radial bones it has, because some of the fossil was missing, but it probably had eight. What’s important here though is that Tiktaalik has a complex ‘wrist joint,” which was claimed to help it walk on land.
Ichthyostega has been found in rocks “dated” at 367 to 362.5 million years old. Because the front flipper/foot was not found, it is not known how many radial bones (if any) it may have had, nor if it had a wrist – however,
Acanthostega, supposedly 365 million years old, did not have a wrist, and had eight radial bones.
So if we were to follow this “fossil sequence,” it would appear that the evolution of the finger has been a wild ride:
First we evolved six fingers, then in our evolutionary ascent we lost two, then gained four back at Acanthostega. Once on land, the number went back down to four (most amphibians have four toes). Apparently we evolved a complex wrist, only to lose it again at Acanthostega, and then apparently re-evolve it back once the critters got onto land.
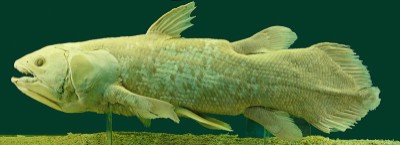 In the meantime, what is not shown accurately on the wikipedia timeline above is that the Coelacanth is actually the oldest known creature on that chart! The oldest Coelacanth known is from Australia and dated at over 410 million years old. Although only a jawbone has been found, presumably it’s at least similar to the other Coelacanths we do know of, which have lots of “radial bones” in its fin!
The Coelacanth has evolved over hundreds of millions of years into… Coelacanths.
So during all this time of Eusthenopteron evolving into Panderichthys, evolving into Tiktaalik, which was supposedly evolving into Ichthyostega and Acanthostega, the Coelacanth remained unchanged and has remained unchanged to this day.
The Coelacanth makes a marvelous study, because before it was found alive, evolutionists were saying the exact same things about it that they are now claiming about Ichthyostega, Tiktaalik, Acanthostega, etc….
In fact, you can still see this bias in modern day reports and websites. For instance,
“the fossilised lung fish – or coelacanth – sets back the timeline for when marine animals made their first excursions on to land….The coelacanth, which the paleontologists describe as a ‘living fossil’ fish with ‘proto legs’, ”
(From I.O.L. Science)
Are these interpretations based on observation? No – because the Coelacanth lives in very deep water, and does not use its fins for anything other than swimming. So what’s this nonsense in the I.O.L. article about excursions onto land? There is no connection – simply evolutionary assumption.
We can observe the Coelacanth behaviour. We can not observe the behaviour of Acanthostega, Ichthyostega, Panderichthys and others because they are not known to be alive now. Therefore, all this talk of using their fins to walk on land is nothing more than wild speculation, the same wild speculation they hurled upon the Coelacanth, which turned out to be false. The evolution of fish to tetrapods is also nothing more than wild speculation.
All of this talk of fish makes me hungry, so I’m going to go fry up some Captain Highliner and some chips. These arguements are arguments from Homology.
The bankruptcy of homology
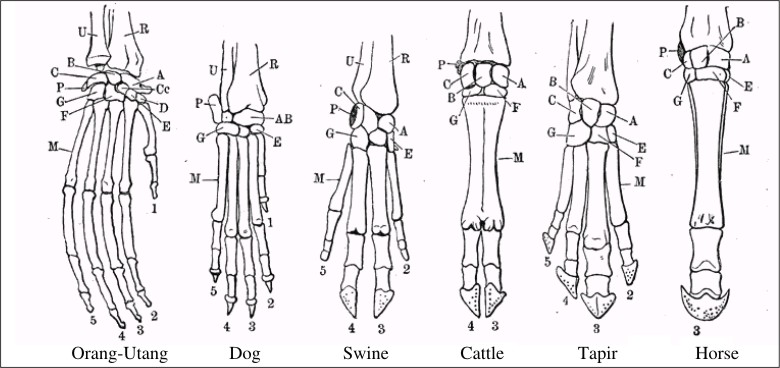 Homology is a comparitive similarity between two organisms. For example, in this incredibly complex-looking drawing:
the bones in the limbs of various animals can be similar in position, structure, etc…
This is a common argument used to promote evolution, as it could be interpreted that these animals all have similar limbs because they evolved from a common ancestor. Thus, they all inherited traits from this one ancestor they all had in common.
It sounds impressive at first, but there a few problems with this interpretation. Bear with me while I get a little technical on ya:
With the fairly new science of genetics, we can now map out what genes hold the blueprints for various parts of our bodies. As a result, we now know that while the bones between two animals may appear to be homologous, the blueprints for these bones come from completely different parts of the genome! Therefore similarity between two organisms is not because of a common ancestor, otherwise, they would also share similar, homologous traits in their genome as well. They do not.
 The similarity between the organisms apparently has nothing to do with a common ancestor, but rather a common designer. One can see a lot of similarities between the early Volkswagens and early Porsches. Is this because they evolved from a common ancestor? No, it’s because they both had a common designer – Ferdinand Porsche.
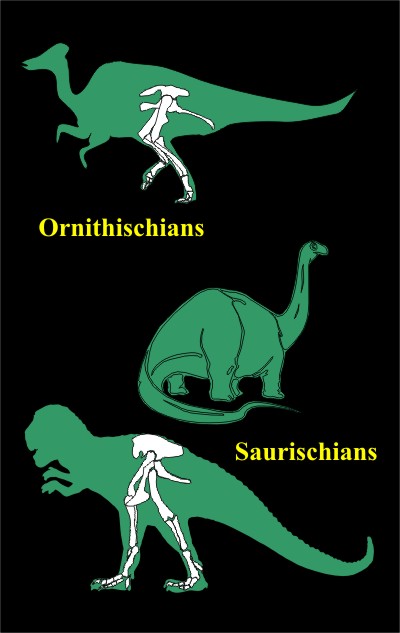
Homology is only cited when it appears to support evolution. Simultaneously, the lack of homology is ignored when it poses a problem for evolution. For example, a great many evolutionists (and National Geographic) believe that dinosaurs evolved into birds.
Many dinosaurs fall into two classes, based on their hip structure.
The Ornithischians are named after their ‘bird-like hips.’ ‘Orni’ is from the Greek word ornitheos, for ‘of a bird,’ and ‘ischion’ for ‘hip joint.’
The Saurischians include bipedal dinosaurs like T. rex and the Sauropods. They are called this because they have hips like lizards and ‘Saurus’ is the Greek word for ‘lizard.’
So put yourself in the shoes of an evolutionist who believes that birds evolved from dinosaurs. Which group would you assume that the birds evolved from? The Ornithischians? Some of those dinosaurs have bird-like feet, some have bird-like beaks, and they all have bird-like hips.
Or would you assume it was the Saurischians? Some of the Saurischian dinosaurs have elephant-like feet, some have bird-like feet, but no other real similarities to birds. They all have lizard-like hips.
If homology were actually an argument for evolution, the answer would be obvious – it would have to be the Ornithischians. However, the dino-to-bird theorists actually believe it was the Saurischians that evolved into birds!
Clearly homology is not evidence for the evolutionary myth.
by Ian Juby | Apr 8, 2015 | Science Notes
Background:
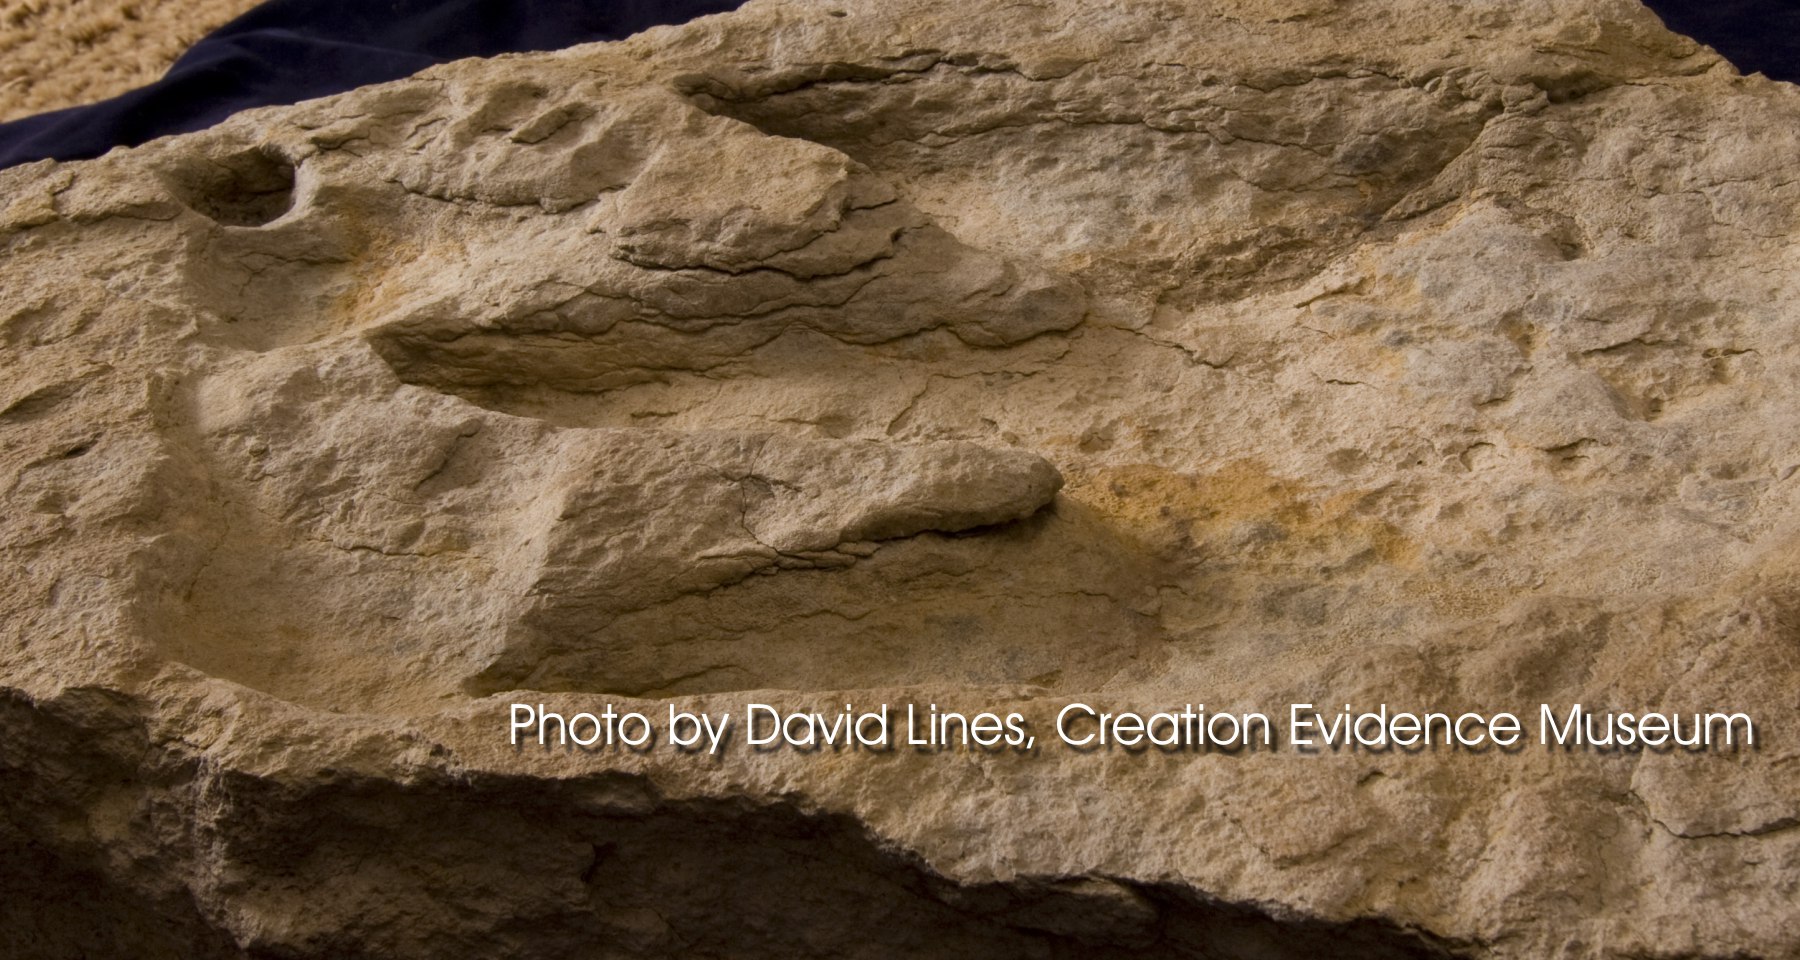
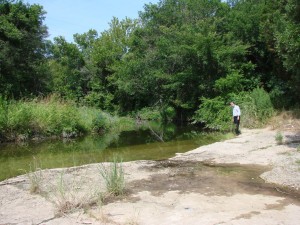
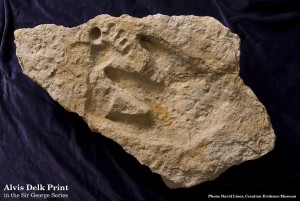
In July of 2000, Alvis Delk was wandering through the Paluxy river, in Glen Rose, Texas, when he flipped over a slab of rock which contained a pristine fossil dinosaur track. These tracks are common in the area, and he took it home for a keepsake.
It sat in his living room for eight years.
Sadly, in 2007, he had a bad accident which left him hospitalized for quite some time. When he got home, he needed money to pay off his medical bills, and began to clean off the dinosaur track in hopes that he could perhaps fetch a few hundred dollars for it.
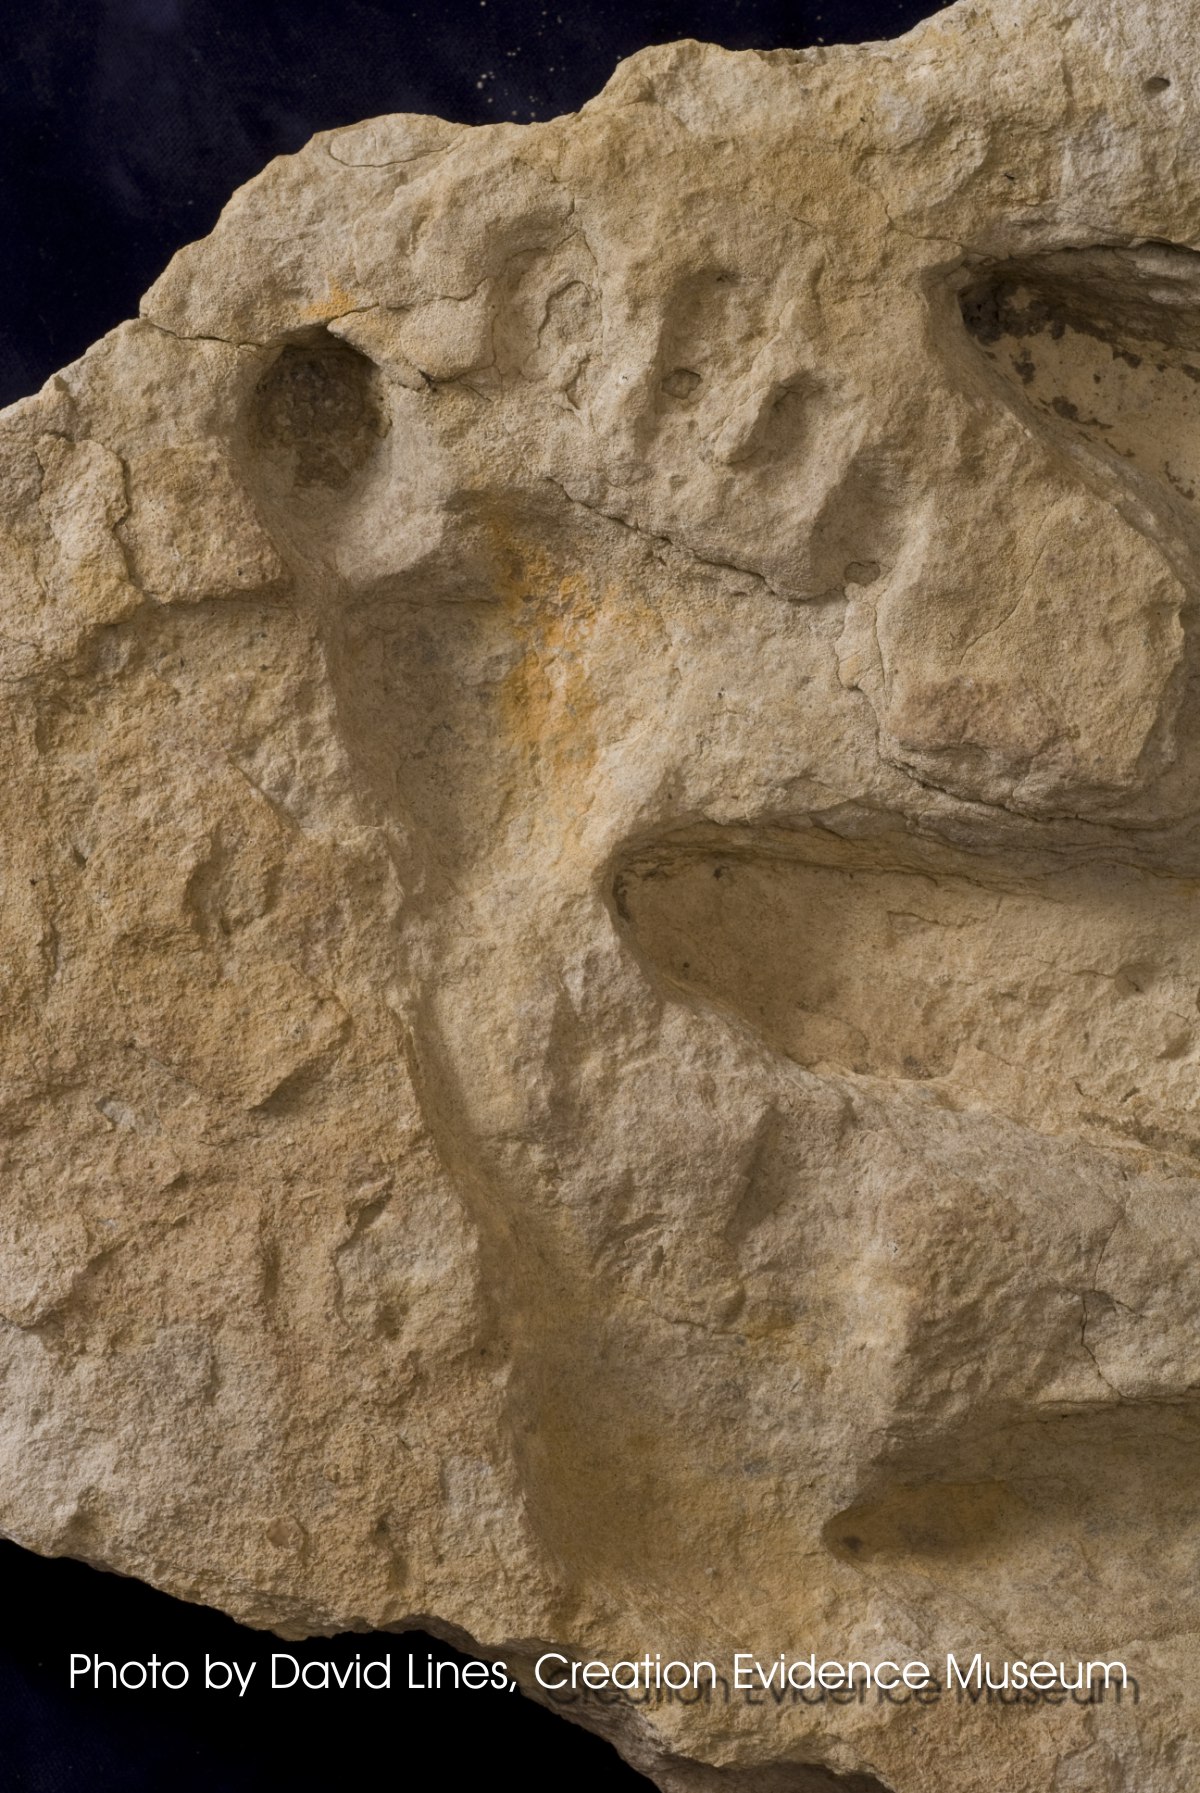
This is when he discovered that was also a fossil human footprint in the rock, still covered under dried clay.
This find has profound ramifications for the Creation/Evolution debate. Evolutionary scholars have admitted that if dinosaurs and humans lived together in the past, then this completely destroys the theory of evolution.
The slab was purchased by the Creation Evidence Museum of Glen Rose, Texas. It was photographed and documented by David Lines, and molded by Dough Harris, Daniel Elif, and myself.
This page is devoted to providing my own first-hand knowledge and information about the track, and to answer many of the common questions and objections.
Common criticisms:
 “It’s a carving”
Hey – maybe! I’d just like to see some evidence of that, instead of this random ad-hoc claim being hurled around as if it were fact.
Unlike the skeptics, who make claims without one shred of evidence, I will actually present evidence as to why they are legitimate fossil footprints:
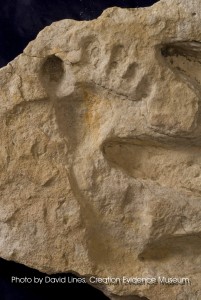
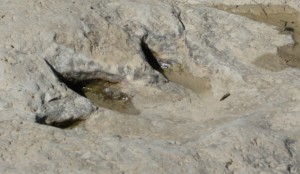
Friability of the rock:
Look at the photo yourself (close-up of matrix); I find it very difficult to believe that a rock this friable could be carved without disintegrating. This friability is quite common in the main track-bearing layer of the Paluxy.
Doug Harris and I spent an hour just claying up all those cracks before molding. We were gravely concerned that the silicone would literally rip the rock to shreds when we de-molded.
So how is one supposed to pound chisels into this rock, or run die grinders on it without shaking / hammering it into pieces?
Interestingly, I would also suggest this limits how far the slab could have been transported by the river. The Paluxy is well known to float slabs of rock the area of a car downstream, and this rock was obviously ripped up from its host rock and deposited where Delk found it. However, this rock simply could not sustain much tumbling – I doubt it went far.
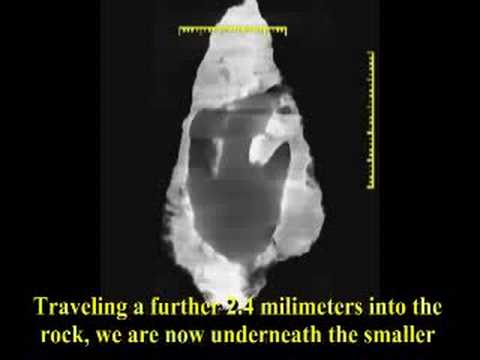
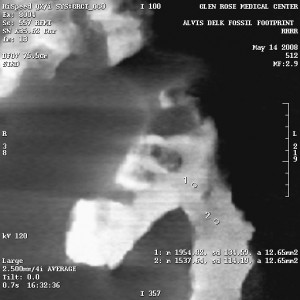
CT scans show compression:
Of critical importance is the results of the CT scans that were performed on the slab. Watch the video at the top of this page to see an explanation of CT scans, how to read them, and see the scans for yourself. Also, head on over to David Line’s page which shows numerous cross-sectional X-rays produced by the CT scans.
These X-rays show distinct high-density areas in the rock immediately surrounding and underneath the tracks. Carving the tracks would have cut through the harder surface layer, and would be visible in the X-rays. Also, the typical claim of skeptics is that forgers in the past used acid to etch the rock after carving a dinosaur track, to hide the tool marks in the rock. Acid etching would actually reduce the surface density of the rock, and would be visible in the X-rays.
Furthermore, Dr. Carl Baugh (director of the Creation Evidence Museum) actually interviewed people who carved dinosaur tracks during the depression. These people tried carving human tracks once in a while (one must immediately wonder why they would do this – might I suggest it was because of the fossil human tracks they had seen in the Paluxy river bed which inspired them?), the human tracks never sold, and so they stopped carving them. Secondly, they never carved a dinosaur track and a human track together, for the simple reason that everybody immediately thought it was a fake and wouldn’t buy the track.
I am open to the objection / claim that it’s a carving, but so far, I haven’t even been remotely impressed by the calibre of skeptical arguments.
If anybody’s got any other ideas as to what it could be, besides a genuine fossil human footprint that a dinosaur stepped on, then I wanna hear it: email me at ianjuby at ianjuby.org
“That’s not an Acrocanthosaurus track”
 First of all, dinosaur track identification is tenuous at best. We were not there when the tracks were made, therefore dinosaur track identification is never anything more than a best guess – no matter who’s doing the guessing. You’re quite welcome to place your guess!
Originally the Delk dinosaur track was identified by Dr. Baugh as a Trachodon, specifically because there was no claw impressions. However, after comparing it side by side to other, actual fossil Acrocanthosaurus tracks in the museum, he concluded it was an Acrocanthosaurus track which simply had not pressed deep enough to leave claw marks.
There is the distinct possibility it could be the track from another dinosaur – I personally don’t care which one, because it’s a dinosaur track. Evidence of dinosaurs and humans living together completely destroys the concept of evolution, as leading evolutionary scholars have admitted.
 “Look how unnatural that human footprint is”
This is where it gets quite comical; because if it was a perfect track, the skeptics would say “it’s too perfect, it’s obviously a carving.” I know this because that’s what they’ve argued before with other human tracks from the Paluxy!
Human footprints take on a remarkable and strange variety of shapes and forms. If you don’t believe me, head down to the beach and examine footprints in sand, mud, clay, etc… You will be surprised. That footprint is completely human, there is no other creature that makes a footprint like a human. Even apes have, essentially, four “hands” – they don’t have “feet.”
In this case, it appears that the big toe got hooked during forward locomotion. Why would a carver carve a track in an “unnatural” position? It would be far more convincing if it were a “perfect” track, so why the imperfection? It makes more sense that it is a legitimate, albeit strange, track.
“It hasn’t been published in a reputable peer-reviewed journal”
Ah yes, this is quite a humorous argument too. No “reputable, peer-reviewed journal” dares to publish evidence like this which destroys evolution. Entire books have been written on this subject, not to mention the recent movie “Expelled: No Intelligence Allowed.” There are peer-reviewed creation journals out there, and this track will be included in our upcoming article on the Paluxy track research. However, evolutionists will simply reject such an article out of hand anyway, because it’s not an evolutionary journal.
Go figure – evolutionary journals won’t publish anything that knocks evolution, therefore because evidence like this won’t be published in evolutionary journals, it is rejected by evolutionists.
I’m not even going to waste much time with this very silly argument that has absolutely nothing to do with whether or not the tracks are authentic.
If there are some scientists who wish to legitimately examine it, I’m sure that can be arranged – but only under very strict control of CEM. Why? Because some evidence like this has been destroyed before. See Don Patton’s website for more details on this episode.
If there’s going to be a symposium / forum for interested investigators, I’ll post details here later.
“He’s not ‘Dr.’ Baugh – he faked his credentials”
Haha! First of all, I’m quite tired of this slanderous lie that’s been promulgated around the internet. I looked into it the whole matter myself – unlike the skeptics who just regurgitate a rumour they heard on talk.organs. Doctor Baugh worked very hard to earn his degree, and this has absolutely nothing to do with the authenticity of the Delk track…. does it?
It pleases me greatly to see such comments and railings, which are obviously nothing more than a desperate ploy to misdirect people from the evidence.
Look at the evidence people – it’s presented here, and ignore the babblings of those who would desperately try and distract you from it. In fact, you might want to ask yourself why they are so desperately trying to distract you from it! Look at the evidence, judge for yourself, and ask yourself what the ramifications are for you if the bible turns out to be true and evolution false.
“CT scans produce ‘beam hardening’ which accounts the higher density you see on surfaces”
(updated Aug 26, 2008)
 Okay, this is going to get a little technical on youse guys (“youse guys” – that’s Canadian for “Y’all”).
After much ado about “beam hardening” artifacts in the CT scans, combined with one comment posted on YouTube, I wanted to be sure about a few things. I called the Glen Rose Medical center and spoke with two separate CT technicians on a variety of issues surrounding the slab, including the technician who actually performed the CT scan on the Delk slab. It was very enlightening.
“Beam hardening” is an artifact in CT scan X-rays that appears at surfaces, including the surfaces of cavities. This was a problem in the early days of CT technology, as well as the early days of Gamma Ray CT. Because CT scans are compiled by computer, an algorithm can be incorporated into the analysis to remove beam hardening artifacts. While I’m not an expert on CT, everything I’ve been able to dig up so far shows that beam hardening artifacts never appear to go any deeper than 1-2 scan pixels below the surface.
Beam hardening is especially prominent with irregular surfaces, and the Delk slab would certainly fall under the category of “irregular surface.”
 Could the higher density be from beam hardening and not from compression of the mud by the feet that made the prints?
In short, it would appear “no way!”
As I had written here before, the high density is not visible around some of the cavities – like the outer toes of the dinosaur track. It is also completely absent from the heels of both tracks. As I argued then (and as the CT technician who performed the scan mentioned without my prompting), this “surficial beam hardening” would be visible on the entire rock, if it were from beam hardening.
Furthermore, the Glen Rose Medical Center’s CT scanner incorporates the anti-beam-hardening algorithms which removes beam hardening artifacts!
Can the very deep, high-density portions be explained by beam hardening or other artifacts?
There was a post on youtube by “ftom” that brought up some very good questions, but made a statement which must be addressed. He claimed 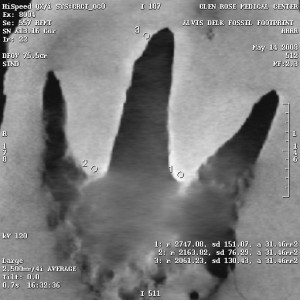 that 4cm deep “higher density” in the rock is not uncommon for beam hardening (at least, that was my understanding of what he said). I choked on this big time, but didn’t want to say anything until after I did some investigation, after all, maybe I’m wrong.
But think about it: Would you spend millions of dollars on a piece of equipment that’s supposed to be ultra-accurate if you can get false readings 4 centimeters deep and wide??!!??? I wouldn’t! Such false readings and beam hardening artifacts would complete invalidate the entire CT technology!
When I mentioned this to the CT techs, both of them remarked that this was flatly impossible. The second CT tech (who did notperform the scans) was looking at the scans on file at the time.
Furthermore, I will reiterate the facts which anyone can see by watching the video and looking at the full-resolution scans here and on David Lines’ website:
- the surface hardness is absent from many places in the rock
 the highest density rock is at the junction of the middle dinosaur toe and the human footprint; where both tracks would have compressed the matrix. It is up to 4 centimeters deep and wide at this point (see below). This makes complete sense if the tracks are both authentic – both footprints compressed that area of mud. This makes no sense when trying to explain it as artifacts like beam hardening, as this is the only place where such large-area, high-density is visible.
- there are portions of the tracks which do not have any surficial hardening. Thus, it is clear that the higher density seen elsewhere is quite real. To claim that portions of the tracks show no higher density and thus must have been carved is a ludicrous argument: Did the carver only carveportions of the tracks? What about the portions that do show higher density and are therefore legit? No – thevariations in density only add to the authenticity of the density readings.
Are the density variations within a reasonable ratio?
There was “fall-out” from this post – click here to read the report.
Nevertheless, ftom made a very pertinent point about the density variations in the CT scans, and asked an excellent question: Are the density variations within reason? i.e., if the highest density was very hard, but the lowest density was that of a jellyfish, then there was a problem. I would agree, so I asked the CT techs to get a better handle on how density is calculated and portrayed on the scans.
As the CT technicians mentioned, they save people’s lives by scanning a tumour and diagnosing whether it is benign or malignant just by analysing the density variations!
It should be noted at this time that the images are also produced to maximize contrast. The X-rays you see have variable grey scales, and thus the pixel colour is not a true representation of the density, merely a guide – i.e., you can’t judge the density of a pixel by its shade.
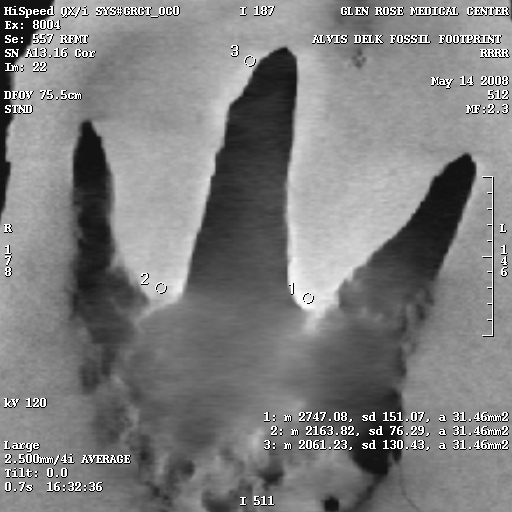
The density variations are calculated using the Hounsfield numbers, and on the right are several select X-rays images from the CT scans, each of which has density sample sites. The circles are the sample areas, and the readings are in the bottom right corner of the image. For example, in Figure 7e, there are three sample sites, and the reading from sample 1 is listed as follows:
1: m 2768.04, sd 292.37, a 36.30mm2
The only important things here are the first and last numbers. “m” is the hounsfield number, and “a” is the area of the sample circle.
To give you an idea of how to interpret the Hounsfield numbers, the higher the number, the higher the density. Hounsfield numbers have the density of water as their zero point.
The CT tech at GRMC very kindly gave me a smattering of sample numbers, so you have an idea of the density/hounsfield number ratio:
- Air inside a lung: -651 (note this is negative)
- Cortical bone: 172
- Liver: 33
- Rib center: 104
- Rib surface: 754
- Vertebrae: 195
So the lowest density sample in the Delk slab is a Hounsfield number of 487 (Figure 7e, sample 3), and the highest 3048 (Figure 7a, sample 2).
One thing can be said with certainty: the numbers are certainly of sufficient density – the lowest density is greater than that of most bone, except at bone surfaces like a rib, which is very hard, very dense, and very brittle.
The other conclusion which can be reached with certainty is that the density variations are real, and thus it is good evidence of compression of the mud matrix by two footprints, before the mud turned into rock.
“Dinosaurs don’t make tracks like that”
Um… yes, they do! Honest!
Q&A
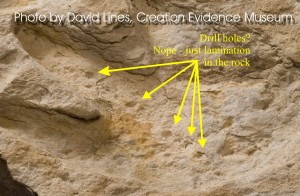
“Are those drill holes making a line up the middle dinosaur toe?”
Nope. That’s actually the deepest part of the track, which happens to break through laminations in the rock in places, as well as some dimples in the rock, giving the appearance of a line of holes. See photo on right. The toes on the human track also break through laminations, leaving similar, circular holes in the rock.
“You mentioned ‘unintuitive compression’ in the video – what do you mean by this?”
 Particularly when Dr. Baugh sectioned dinosaur tracks from the Paluxy a number of years ago, it was noticed that sometimes there was no visible deformation underneath the track. There was no doubt about the authenticity of these tracks, so what was going on? Furthermore, Professor M.E. Clark (University of Illinois at Champaign/Urbana) who is a Paluxy track veteran of a few decades, also noted the lack of visible compression artifacts underneath a dinosaur track that had been broken in half when a ledge on the side of the Paluxy had broken off, revealing the cross-section of the track.
The Loma Linda university research report also sectioned a dinosaur track and a human track, both reported to have come from the Paluxy. They cited the lack of distortion underneath the dinosaur track as evidence it was carved. Sure – maybe it is a carved track – but the lack of distortion of the laminations underneath a track is not definitive of a carving.
However, the presence of laminations distorted by the foot when making the track is obvious evidence of authenticity.
When the Burdic man track was first sectioned across the ball, it showed no apparent distortion of the laminations in the rock – however, sectioning towards the heel and toes revealed incredible and dramatic distortion of the laminations. See Don Patton’s report here to see the distorted laminations yourself.
“There appears to be a thin layer of higher-density rock on all edges of the slab – care to comment?”
There does appear to be higher density patches on the edges of the slab, though it is also absent from patches along the edges as well.
Again, this is probably crystalization over time. We do not know when this rock was ripped up from its host, we don’t know how long it sat in the river, and we don’t know how long it sat on shore. Thus, the idea that it is surface hardening/crystalization over time seems a reasonable explanation.
Please note however, that this does not invalidate the higher density associated with the two tracks in any way:
1) Both tracks have areas (particularly the heels) where there is no higher density rock
2) The density variations associated with the tracks are dramatically deeper and wider than any of the surficial high density – by a factor of up to 3. In particular, the displaced mud at the intersection of the human track and the middle dinosaur toe was first compressed by the human, then displaced by the dinosaur. This high-density area is over 4 centimeters deep and wide, whereas the surficial high-density layer seldom exceeds 1.5 centimeters.
The dramatic variations in the density lend much credence to their authenticity. The variations appear to be quite real, and align well with the ichnofossils being genuine.
“What if someone carved the rock, and then etched it with acid?”
To answer this deep question, one of our researchers, David Lines, took some gen-you-whine Paluxy limestone – the very same stuff the dinosaur and human tracks are found in – and soaked it in muriatic acid. Read his very technical report here.
In short, acid wouldn’t affect the CT scans, although if it did, it would show up as a less dense surface.
by Ian Juby | Apr 1, 2015 | Science Notes
Preliminary reports of sedimentation experiments held at Glen Rose, Texas, March 2007
Brief: In mid-march, 2007, M.E. Clark (Professor Emeritus, U of Illinois @ Urbana), Andrew Rodenbeck and myself performed a series of experiments over two weeks at Creation Evidence Museum in Glen Rose, Texas. The museum grounds have a rotary flume which was constructed by M.E. and Dr. Henry Voss, and was transported to Glen Rose some years ago. M.E. also brought down “Archimedes,” a specially designed and constructed liquefaction tank which will be discussed later. While we were there, we also constructed a linear flume, and had intentions to experiment with silica lithification processes, but ran out of time.
Many lessons were learned which altered my personal views on a number of things and have significance for the geology caused by the global flood of Noah. Specifically, the rotary and linear flumes, and just about everything we did with water (including a simple garden hose) produced layers. Probably the most dramatic results were the production of complex cross-bedding. The process was remarkably easy and solidifies the arguments that crossbeds within the geologic record were indeed formed by a global flood, and not by desert dunes as some have argued. Newts were also placed into the linear flume during runs and their behaviour also confirmed some hypotheses regarding the formation of the coconino fossil trackways that are so prolific throughout the Grand Canyon and area.
While it seemed everything we did led to sedimentary layers being formed, much like what is seen in road cuts, liquefaction was the ultimate destroyer of layers. For myself, this was a fairly radical change in my thinking, as I had wanted for years to perform experiments in liquefaction, and the results were pretty much the exact opposite of what I expected.
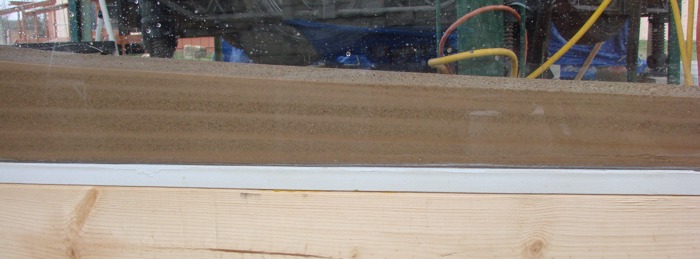
The Rotary Flume:
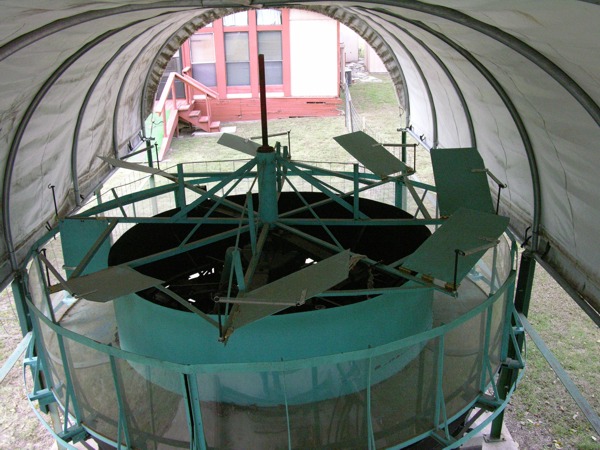 Shown on the right is the rotary flume. The operation is quite simple: The outer, plexiglass wall and the inner, green wall form a tank roughly 12 feet in outer diameter and 8 feet in inner diameter. The paddles are in the upright position in the photo, but spring-lock into a downward position during the runs (paddle at far left is in the “locked” position). The tank is filled with water and sediments, and the paddles drag in the water. The paddles are spun in a counter-clockwise direction, pushing the water in the tank around in the circle, which picks up and carries the sediments in suspension. When the rotation is stopped, the now forward-moving water pushes the paddles out of the locked position, which then spring up out of the water to avoid the turbulence and drag of a stopped paddle in the now flowing water.
The sediments settle out of the water as the water slows down and eventually stops.
The principle of the rotary flume is to produce an infinite flow or wave. When we first arrived, this was the first time using the flume with the new, spring-loaded paddle mechanism. We did not know what to expect entirely, but had some educated guesses. Sand was hauled and cleaned, extremely fine dust was also obtained from a wash along the Paluxy River, and extremely fine, white, silica sand was bought from the local hardware store.
Upon filling the tank with water and pouring in sediments, we immediately saw what was to become the rule: The sediments sorted themselves out in very clear layers. This became so common that by the end of two weeks, we jokingly referred to Andrew’s law as “It’s difficult not to make layers,” and Clark’s law as “It’s easy to make layers.” Later on, I proposed the “law” that liquefaction destroys layers, as much to my surprise as that was.
 We ran up the flume in a series of tests with essentially the same sediments for the first couple of runs while varying the water depth. Multiple layers of varying numbers were made throughout the flume, and numerous cuts made in specific locations (randomly selected at first, then simply copied in later runs), followed by a complete circumferential cut on all runs. Posts on the outside frame were labeled by myself, and in hindsight I wish I had labeled them differently: The first, double post for each section was labeled with a negative number; i.e., A-1. Going counterclockwise, looking from the top, they then increased in sequence until the next double post marked the next section. Thus, A-1 and A1 can easily be confused. So, please be aware of this denotation throughout the rest of this report.
 Because of Guy Berthault’s previous research with flumes years ago, we half-expected to get three layers. Instead we got everything from one uniform layer to seven layers. Before the first run, Andrew correctly pointed out that the inner diameter of the flume would have slower-moving water than the outer diameter, and thus the sediments would settle on the inside first. Not only was this true, but usually the sediments settled out without us seeing it at all, as the sediments would never reach the outside, plexiglass wall.
The differential water speeds also led to complex vortices and helix spirals in the water, which led to complex and confusing layering. However, several principles were verified, namely the fact that layers are formed by flowing water – and quite easily.
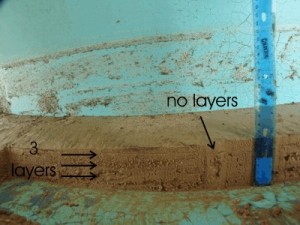
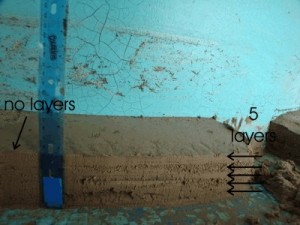
Of especial interest was interbedding that was quite apparent, with three layers fingering in to one solid layer, then fingering to five layers.
 Also of special interest was a small worm that accidentally got mixed in with the sediments. Andrew happened to cut exactly the correct spot on one of his sectionings. The worm was polystrate (yes, it cut through layers), and the top portion of it was bent over flat within a layer. The reason this is of interest is because this is precisely how a fossilized worm was found in the overburden limestone removed from the Paluxy riverbed in 2003. Also on display within the Royal Tyrell museum in Drumheller, Alberta, is a depiction of three polystrate worms found in the Burgess Shale of Canada. The Paluxy is quite unique in that fossil worms (sometimes still with pigment) are plentiful, and I was quite happy to see the same effect in the Burgess shale.
The point here is that a sediment-laden water flow deposited a dead worm in the upright position, precisely the same way one was found in the Paluxy limestones, which also have plentiful indications of being deposited by a strong current. (I apologize for the lousy photo – my macro mode got turned off without my realizing, and I weren’t none too happy ’bout it neither!)
In the end, we saw pretty much every stratigraphical feature produced: Crossbedding, fingering, thinning and thickening of layers, interbedding, and scours.
The Linear Flume:
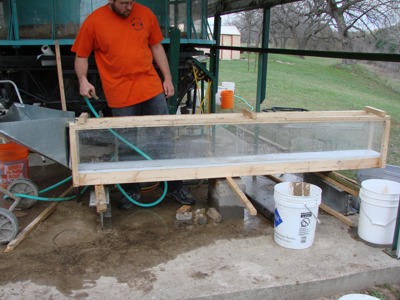 Due namely to time constraints, our linear flume was very simple. It was a clear-walled (acrylic plexiglass), long box, measuring 6 inches wide, 1 foot tall and 8 feet long. A steel trough, or funnel, was at one end to facilitate ease of loading sediments and water being poured in. The other end was left open, emptying into a container which was merely to recycle the sediments while allowing the water to overflow the container.
A conventional cement mixer was used to keep the sediments homogenized, and a continuous stream of water was added to the mix during the runs.
The linear flume not only gave us plenty of radical lessons to ponder, but also enlightened us as to some of the complexities of layering within the rotary flume. Specifically, we took the lessons learned from Berthault’s experiments and not only found them to be true, but that they applied to a much broader scope of sedimentology than I personally thought – both in the field, and in the lab. For example, it appears now that horizontal layers we see throughout the geological record (and which we produced in the flumes) may really just be extremely long-wave crossbeds.
Berthault’s main point from his experiments is that sediments sort out by particle size, not density! This certainly seemed true in all of our experiments. While obviously density played a role, it was a minimal one which was usually so insignificant it could be safely ignored.
The reason is not so obvious at first. I very much like the way Andrew explains the sediments being held in suspension: He refers to the particles as “flying,” which really is what they are doing. They are flying in a very dense fluid – water.
The density between two sediments may be as large as 0.1 g/cm3, for example – but when you are talking about two particles 10 microns in diameter, their difference in density is so small as to be extremely difficult to even measure. However, the velocity of water needed to suspend and carry a particle 20 microns in diameter is significantly greater than that required to carry a 10 micron particle.
To bring this to layman’s terms, envision a boulder made of quartz that’s 30 centimeters in diameter, and a boulder of limestone that’s 60 centimeters in diameter. The quartz is considerably denser than the limestone, yet the larger rock is obviously much heavier than the smaller rock, and thus will require water moving at significantly higher velocity to pick it up and carry it. If they were both the same size, the water speed required to pick up both rocks would be different, but the difference would be nowhere near as great as the difference between two boulders of differing sizes.
The unusual thing noted when observing settling sediments is the tendency to sort out into three layers: fine on the bottom, coarse in the middle, and fine on top. Berthault’s explanation seems to hold water: The flow of water at the bottom of the tank (or river, or lake bed, or stream bed) is almost zero because the bottom of the tank is not moving with the water. Friction causes a rolling of water along the bottom, thus there is a very thin layer of almost stationary water at the bottom of the tank. We refer to this as the “boundary layer.”
Because the larger grains require the fastest moving water to carry them, they wind up settling out of the flow first, as the flow slows down. However, within this boundary layer, you get water velocities which may be slow enough forall grains to drop out of the flow. The largest grain winds up settling first, and the gaps between it and the other largest grains are filled in with the finer grains – up to the top of the largest grain. This makes the first, bottom layer that appears at first glance to be all fines.
As the water slows down, the large grains then drop out, largest to smallest, making a “pile” which grows horizontally. Finally, the fines are the last to drop out because they require the least amount of water velocity, and thus they make up the final layer of fines on top.
I will continuously refer to these three-layer sequences as they continually cropped up, and are probably related in some way to cyclothems which are well known in the rock record.
Experiment #1: rapid emptying of entire sedimentary batch.
For the first experiment, I was operating the mixer. It was filled with our variety of sediments and topped off with water. After a brief mixing run to homogenize the sediments, I simply poured out the entire contents rather rapidly. Total contents was probably around 12 gallons worth of water and sediments, poured out in roughly five seconds. I had built a hill in the middle of the flume, which was promptly wiped out by the flow and had little to know effect on the very evident layering:
The layering was very long and the layers thin.
Experiment #2: Slow, continuous pour
The second run was a continuous pour of the same contents, with continuous water flow. The whole pour probably lasted roughly 8 minutes or so and also produced very distinct layering.
Experiment #3: Pulsed flow
 M.E. and Dr. Voss produced a paper on the subject of tidal action during the flood of Noah for the 1991 ICC. The scriptures are quite clear that it took 150 days for the floodwaters to rise above the highest mountains, and thus during this time you will have tidal action influencing the continually advancing floodwaters. Every twelve hours would see a mini-tsunami encroach upon the land, each higher than the last one.
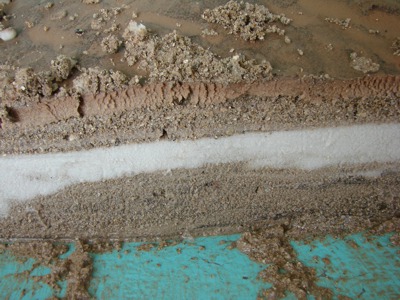
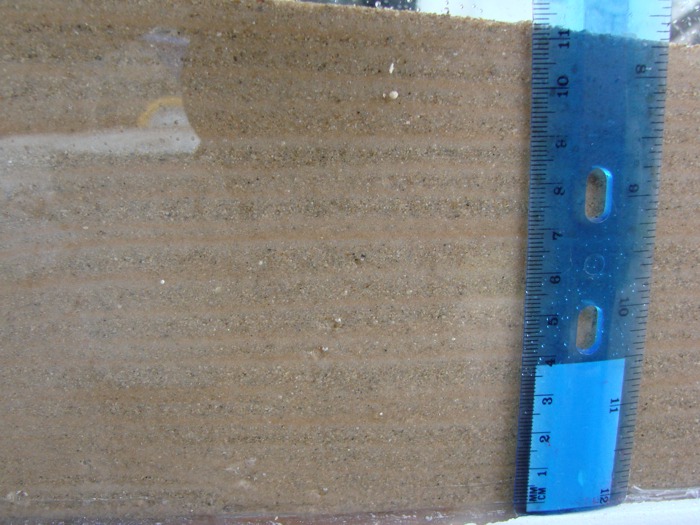
To simulate this, we pulsed the flow of sediment-laden waters. This produced the most dramatic horizontal layering, with the number of three-layered sets corresponding the number of pulses, or waves, we sent through the flume. This is probably related to the cyclothems we see within the rock record. Note the repeating sequence of layers, from bottom to top: coarse, white, red; coarse, white, red, etc….
Experiment #4: Uphill flow
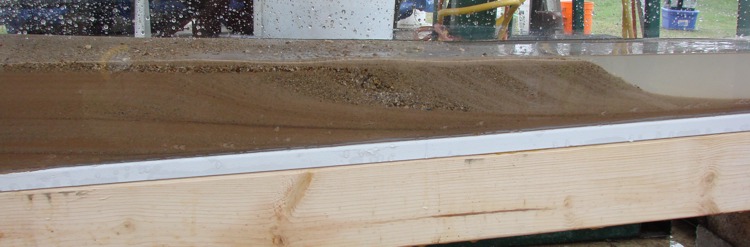
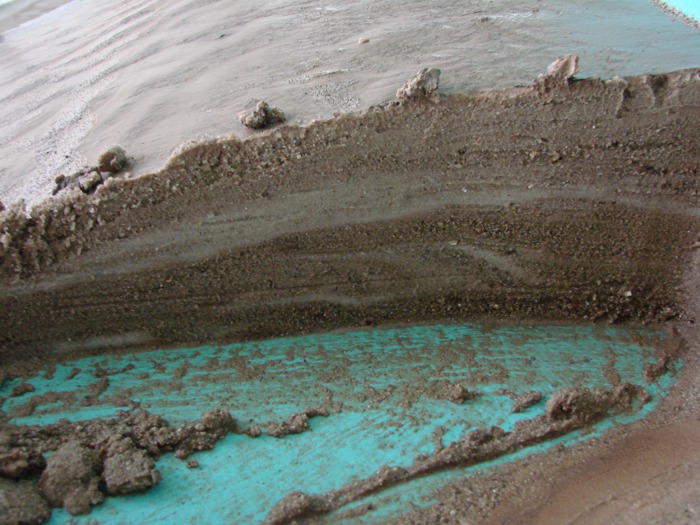
This experiment led, serendipitously, to the most dramatic find of the two weeks. We merely tilted the flume so that the water and sediments had to go uphill a mere 2 degrees. This produced some rather dramatic crossbedding.
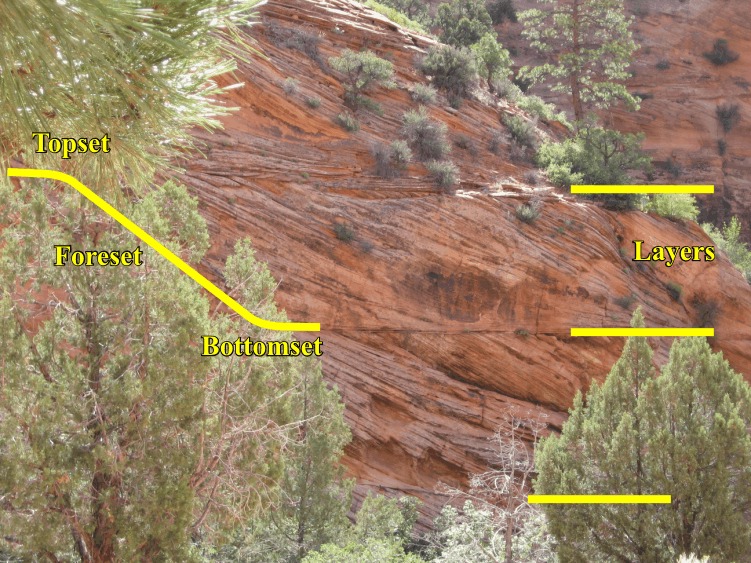
Allow me to introduce what a crossbed is. This photograph is from the Navajo formation, taken within Zion National Park. You’ll notice thick layers on top of each other, and within those layers are angled layers. These angled layers are called crossbeds, and the crossbeds are composed of three parts: The topset (the top, swooping downward curve), the foreset (the face of the slope), and the bottomset (the curve leading from the slope, leveling out against the top of the last layer).
I had a personal goal to produce crossbedding while we were down there, so I was thrilled to say the least. However, none of us were expecting the ease at which it was produced. This one experiment led to an understanding of their genesis, and led to a series of experiments in the linear and rotary flumes.
The secret was standing water. While Andrew and I were well aware that Berthault had produced crossbeds in the lab, we considered his method unrealistic in nature. In Berthault’s experiments, they had a horizontal, linear flume in which they had water and sediments flowing through. He then dropped a door at the end of the flume, causing a backwash up the flume. Neither Andrew nor I considered this realistic to nature, nor applicable to the global flood of Noah: What was this magical dam that suddenly appeared on land, blocking the floodwaters of a worldwide flood?
However, sediment-laden waters encroaching on land and encountering an uphill will pool standing water ahead of the sedimentary deposit it’s producing. It isn’t the uphill that’s the key, but merely standing water – which could be an inland lake, water coming from the other side of the continent during the flood, or pooled water from the last tidal wave flowing back out to sea.
The fast-flowing water is carrying sediments in suspension. Once it hits the standing water, it suddenly drops speed dramatically – well below the velocity required to hold the sediments in suspension. The sediments “drop like a rock” (pun intended), and make a steep slope much like a conveyor belt will as it drops sand in a pile. In this case though, the conveyor belt moves along with the pile!
The sediments fill in the standing water area, moving the front edge of the standing water ever farther back and making an ever-longer platform for the fast water to ride on. Thus, the crossbeds continually build into the standing water – sometimes at remarkable speeds.
This also has some interesting ramifications: If the flow truly is going uphill, then the standing water and the incoming water have no place to go – thus, the crossbeds will thicken inland as the standing water deepens.
Back to the rotary flume:
 At this point, Dr. Clark suggested tilting the rotary flume to acheive an uphill on one side. The rotary flume is mounted on several jackscrews, so we applied roughly a 2 degree tilt. We added extra water and ran it. If there were crossbeds, they were formed from the center out, on an extending, radial arm. However, this experiment demonstrated that it was not the uphill nature of the deposition that produced crossbeds, rather it was flowing water hitting standing water. Because all of the water in the rotary flume travels together, there was essentially no standing water and only brief pulses of backflow.
The high point was at C-1, with the low point obviously being between E2 and E3. Layers were produced, but I would say less that we had before – it seemed to make a mess more than orderly layers, but still produced them in line with Andrew’s and Clark’s laws. Essentially no recognizable crossbeds were formed. The following radial cut was made at E1:
More experiments in the linear flume:
We then proceeded with a couple of experiments relating to crossbedding.
We first performed a run with a very aggressive introduction of sediments and water into a 1 degree uphill slope. Andrew and M.E. were operating the equipment, and both Dr. Carl Baugh and myself witnessed very steep-sloped crossbedding being formed,
but within a fairly thin bed (the reasons for this will be discussed later). This is mentioned in passing because while both Baugh and myself witnessed the crossbeds being formed, when we were finished, the sediments were so uniform as to appear to be one thick layer with no crossbedding! Thus, it appears that perhaps some layers within the geological record may very well have been formed by a cross-bedding process, but leaving no distinct crossbedding. For myself personally, I will be looking at layers and rocks differently in my investigations in the future, though hindsight of all that I’ve seen has not brought to remembrance any layer anywhere that looked like a solid layer that broke apart into angled layers like crossbedding.
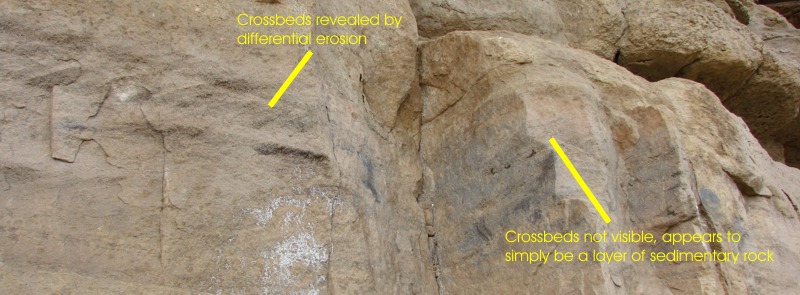
Addendum, April 25:
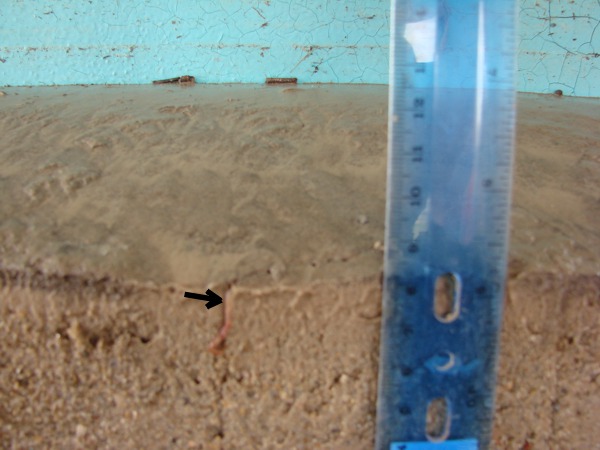
Only weeks after we completed these experiments, I was out on a field trip with Mike Oard and Andrew Snelling in the Rattlesnake Mountains water gap in Montana. I stumbled upon this layer which usually appears as a simple layer of sedimentary rock. However, differential erosion had revealed that it was indeed crossbedded, but the crossbeds are not visible except by differential erosion.
Again remembering our model of tidal formation of layers, we would have a main tidal wave every twelve hours. Riding on top of this wave would be countless smaller waves; perhaps as big as ocean waves today – which easily achieve 5 to 10 feet high. In this particular experiment, waves were superimposed on the flow of sediment and water being introduced. The waves were not deliberate, but rather simply the result of the equipment being used. As a wave would charge into the standing water, it would displace the standing water with a standing wave. This wave would then collapse into the “vacuum” left behind at the face of the crossbed, slamming the sediments into the crossbed and producing incredibly steep crossbeds.
In an attempt to make two sets of crossbeds on top of each other (much like is seen at Zion National Park), we performed two runs. We produced crossbeds in the first run with the flume merely tilted uphill at 1 degree. We then blocked the drain end of the flume, creating a 4″ high dam, and filled the flume with standing water.
While Andrew and I objected to Berthault’s dam at first, we realized that the dam was not the point: The standing water was the point. There is a variety of ways that standing water can be produced inland during a global flood: The rains being trapped, lakes, small seas, etc… I had proposed that because the east coast had essentially no crossbeds, yet the west (Arizona through Utah) had extensive crossbeds, that perhaps this is the where the two water flows of Noah’s flood met (the Rocky mountains having not yet formed)- one flow from the east coast, and one from the west coast. Andrew shot this idea down in flames by pointing out the dinosaur tracks among and above the crossbeds. However, later on I also proposed that one big wave will build up a heap of sediments along a shoreline. When we are dealing with a global flood, I have no qualms envisioning a very large sedimentary build-up forming a dam on the shores of the coasts; thus the dam is not in front of the flow, but rather behind it. This dam would trap water inland from the last tidal wave.
At any rate, standing water was the key, so we produced some by merely blocking the end of the tank and filling it up, on top of our previously formed crossbedded layer. We then ran an agressive run, same as before.
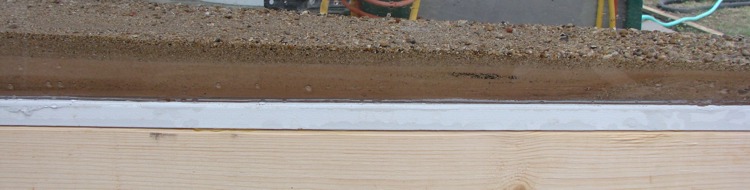
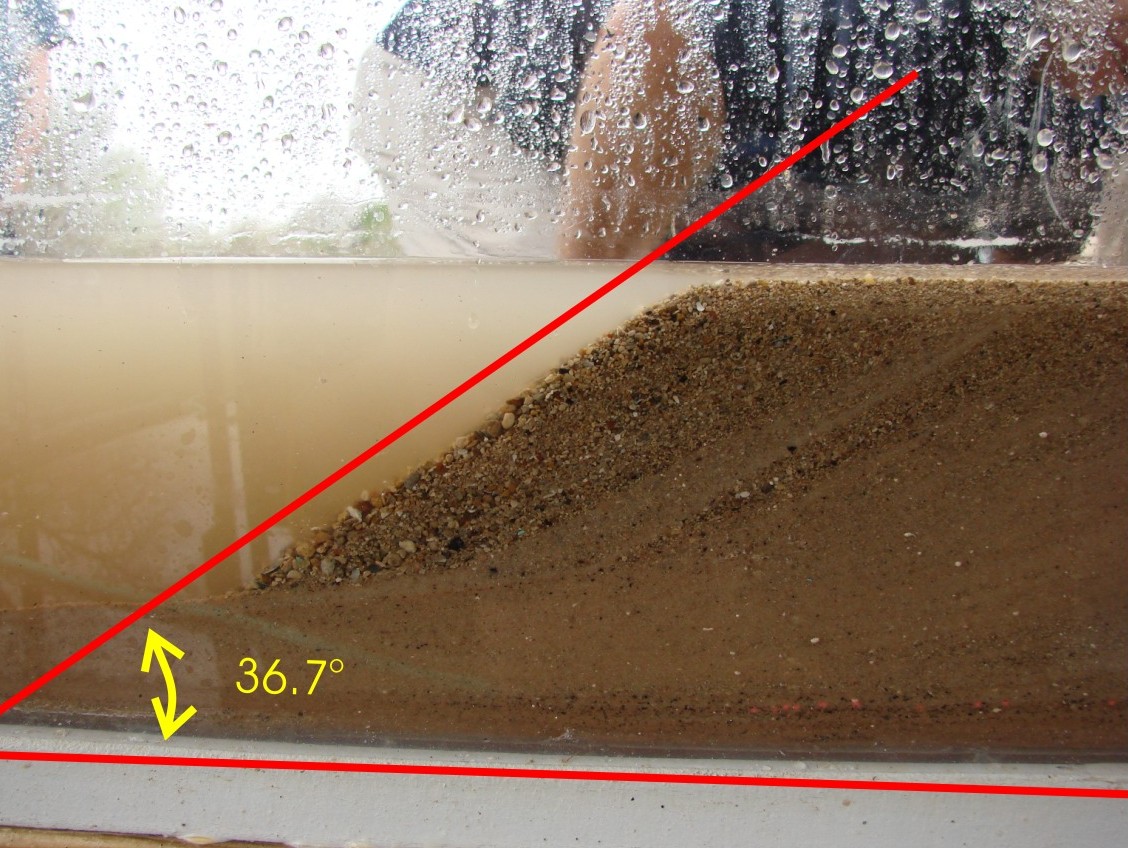 Global flood skeptics have argued that wet sand will not produce crossbeds as steep as dry sand. Such a suggestion is ridiculous: If one merely takes a moment to ask oneself, “Which can produce a steeper bank? Dry sand? Or wet, sticky sand?”, the answer becomes quite obvious. We also had Dr. Floyd with us on the last day of the runs, and he surprised me by saying that the geology textbooks specifically say that water will not produce crossbeds steeper than 30 degrees. This amazes me because we produced 37 degree crossbeds with little effort, using fairly crude techniques! I am fairly confident that if we worked at it, we could achieve crossbeds meeting or exceeding 40 degrees. This photo is from the run we performed for the TV crew:
The grain size had no effect on the angle. However, in our experiments, because of the equipment we were using, grain size tended to coarsen throughout the run.
Further crossbeds, and the reactions of newts:
We also ran one experiment which produced crossbeds with newts in the water. This was done to examine their behaviour in flood conditions which produce crossbeds, in hopes that our observations would shed light on the prolific fossil tracks found in the coconino sandstone crossbeds – which I think it did.
To finish off the experiment and produce crossbeds to be left for the next day when a TV crew that was there, we cleaned up the flume and loaded the mixer with a double load of sediments. We left the 4-inch high “dam” at the end of the flume and put in some standing water, though it was not filled completely. The newts being as newts are, were quite content in the water and very docile. It probably would have been better to have creatures (such as lizards which are not amphibian) which are not inclined to “hang out” underwater, but the newts still provided quite an education.
The crossbeds were produced, same as before. While one newt swam around, the second was quite content to stay at the bottom of the crossbeds being formed. The answer became obvious: he was sitting the eddy currents; the place where the water was the slowest. Thus, the newt really didn’t have to move or fight any current. He was quite content to just sit there.
The encroaching crossbeds would eventually begin to cover him up, so the newt would simple “step up” onto the new crossbed.
Several lessons were learned:
- This can explain why fossil tracks are so prolific on the foreset and bottomset of crossbeds. The tracks in the coconino have not been positively identified but could be either lizards or salamanders. They are quite consistent in only traveling uphill. If the tracks are from salamanders, the same salamander could potentially be producing multiple trackways on the foresets of hundreds of feet, or perhaps even miles, of crossbeds. The salamander would “hang out” in the eddy at the bottom of the crossbed, and would simply walk up the crossbed when he was getting buried, float away and catch the eddy once more, returning to the bottom of the next crossbed.
- Animals (such as lizards) which are swept away by the flowing waters would be sucked into the hydraulics and trapped by the eddy currents. Every year people die by being trapped in the hydraulics at the bottom of decorative dams and small waterfalls – the water is very powerful, even in small volume. In this case, the forming crossbeds make the escarpment that the hydraulics form at, thus trapping animals in them. The only way out was to go up the hill. Thus we see why the trackways in the coconino are almost always going uphill, and often show the creature being bouyed up to produce a trackway that goes from heavy foot impressions, to lighter, to claws only, to completely disappearing – often within only a few feet.
- The preservation of tracks within the crossbeds is now easily explained: The water along the face of the foreset is virtually still. Simultaneously, there is a continuous dumping of sediments on top of any freshly made tracks, thus protecting them until lithification of the sediments.
Conclusions of crossbed research:
- the depth, or thickness of the crossbedded layer is determined by the depth of the standing water. With an agressive flow, the layer will be slightly thicker than the depth of the standing water, otherwise it will pretty much be the same thickness as the depth of the standing water.
- the crossbed dip increases during the formation. The maximum angle of the crossbeds are determined primarily by the speed of the water carrying the sediments and forming the crossbeds. More research needs to be performed to determine the relationship. The only other factor in this is the distance from the starting point of deposition. As can be seen in the videos and pictures, a “base” needs to first be deposited, built up to the depth of the standing water. The crossbeds begin to form immediately, increasing to their maximum angle shortly after the deposition depth has matched the standing water depth. Once the maximum angle is acheived, it varies with the flow speed of the incoming water.
- the crossbeds which are sometimes thin and sandwhiched between perfectly horizontal layers are now easily explained: The layer in the middle was simply formed with trapped, inland, standing water present while the layers above and below were not. A simple beach dune, produced by the last inland flow of water, would trap water inland which then became the standing water during the next depositional episode.
I’ll interject my own, personal opinion here which is not necessarily shared by M.E. or Andrew: I am now quite convinced that the crossbeds of the coconino and navajo formations (as well as gravel crossbeds in various locations) are produced by water; convinced to the point that I will be dogmatic about it. The evidence overwhelmingly points to a watery origin.
Crossbeds as a paleocurrent indicator:
Water-formed crossbeds are, in my opinion, easy to recognize compared to wind-blown sand dunes. Wind-blown sand dunes have remnants of the windward and lee sides preserved somewhat in the crossbeds. For example, this is a photo of a sand dune in eastern New Mexico that had been cut by a bulldozer:
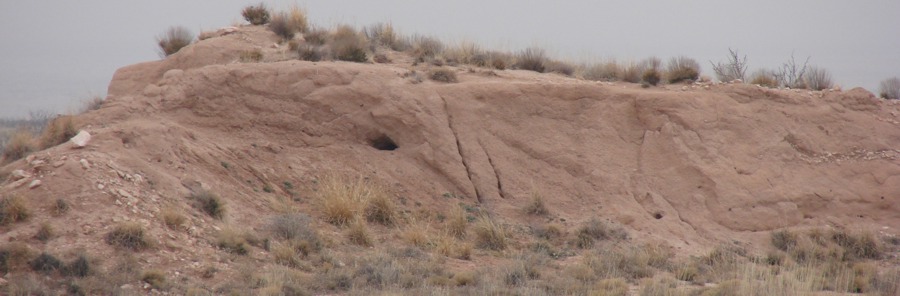
While the dune did have bedding planes (layers), and if one were to look strictly at one side, one might interpret that one side’s layers as “crossbeds.” However, looking at the breadth of the dune, one can see the layers curve right over to the lee side (on the left), within only a few feet. The crossbeds we see throughout the west go on for many, many miles with no windward side evident. This is exactly what we would expect with a continentally-deposited crossbed layer, and completely contrary to what we see with modern sand dunes. While a lot of the crossbed layers we see in the stratigraphic record are considerably thinner than the height of the sand dune above, we can see layers on both sides of the sand dune (roughly 12 feet high)- but never see the windward side of the crossbeds.
There is one wildcard here: Andrew would suggest that there are many, giant sand dunes in deserts today which were laid there during the flood; and I would tend to agree.
Addendum, April 25: David Lines pointed out that there are clear crossbeds within the White Sands of New Mexico which match our crossbeds identically. This of course has been used to argue that wind-blown sand dunes produce crossbeds. However, I would contend that this evidence precisely demonstrates that the white sands were originally laid down by water and are now being reworked by the wind! The above photograph is of a sand dune which has clearly been formed only by wind. The dune has moved enough that if it had been originally laid down by water, any remnants of the layering left behind by the working of that water has been destroyed by the reworking of the wind. Thus, what we see are only the effects of wind and not large quantities of water. Crossbeds are only formed by water.
Thus, water-produced crossbeds which are positively identified within the stratigraphic record (be they sands, gravels or boulders), can be used as a paleocurrent (ancient water flow direction) indicator. I have personally examined crossbedded layers by the hundreds throughout North America, and I cannot think of a single one that even has the potential to be a wind-blown sand dune. They are all missing the tell-tale windward side of the dune. Thus, we can incorporate crossbeds into the mapping of megatrends in paleocurrents: A valuable study reflecting what went on during the global flood of Noah.
Liquefaction Experiments:
 Liquefaction is a state in which sediments are temporarily suspended in water, usually from water percolating up through them. This effect can be seen by working wet concrete, vibrating mud, or even during earthquakes.
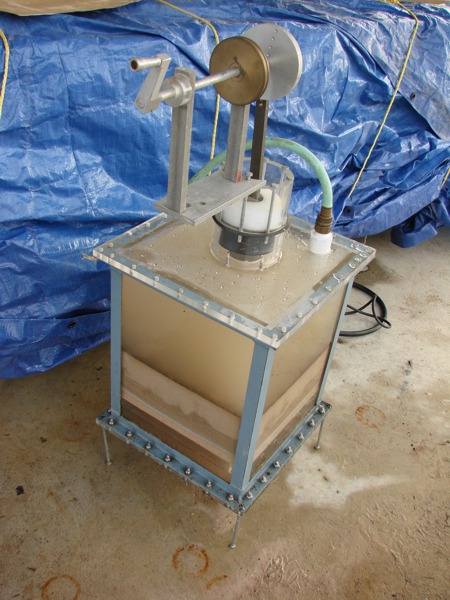
Archimedes was built by our late friend, Don Yeager, from Oklahoma. Sadly, Don passed away literally the day we returned home after performing our research. Archimedes consists of a sealed acrylic box designed to withstand some pressure. Spaced off of the bottom is a membrane which allows water to pass through but not sediments. Beneath this is the inlet from the water pump, and water from this pump goes through a series of baffles to spread out the flow so that it is as uniform as possible throughout the base of the entire unit.
Sediments are loaded into Archimedes on top of the membrane, and the pump intake sticks down from the top of the unit.
In the center of the top is a large, rolling-gasket piston which cycles up and down to induce pressure upon the water and sediments inside the unit. This is to simulate the pressure of waves during the global flood, and the pump’s water flow is to induce liquefaction of the sediments. The two mechanisms can be used separately, or in conjunction with each other.
I came to the table with a long-standing desire to perform research in this area of liquefaction, as it relates to the global flood of Noah. I had high expectations that not only would the process produce layers, I had more than one model I had developed in which I used liqeufaction to explain anomolies in the geological and fossil record. I suspected this research would verify some suspicions I had.
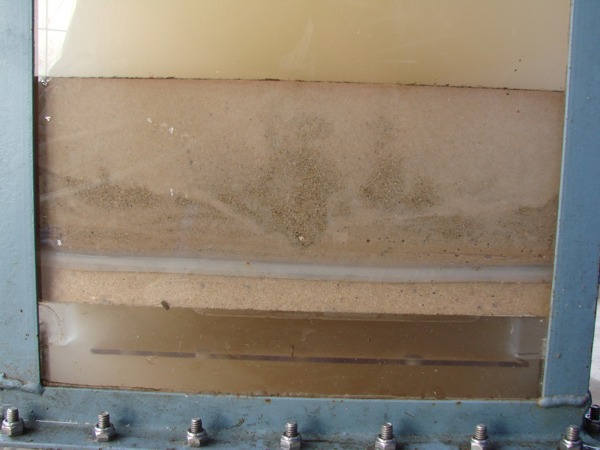
Much to my surprise, it became evident very quickly that liquefaction does not produce layers, it destroys them.
I do need to qualify this statement however: liquefaction did indeed sort (more or less) the sediments by density. However, the resulting “layers” were hardly layers at all; they blended together and if the system was to become lithified (cemented, or hardened into rock), it would be one, thick block. If I saw these layers in the geologic record, they would be interesting and noteworthy, but I wouldn’t call them layers; I would call it a layer fining upward.
Futhermore, in an attempt to homogonize (uniformly mix-up) the sediments that were loaded into Archimedes, I stuck a high pressure garden hose into the pump return hole and blasted the sediments with high-speed water. To my surprise, this made layers! In fact, try as hard as I could, the only thing that best homogenized the sediments was liquefaction!
 Some have suggested (and I personally believed, until now) that cycles of liquefaction during the flood were what produced layers. To affirm/refute this, long period cycles were run in Archimedes. All effects were finished with about 30 seconds, whether liquefying or settling the sediments. We ran 20 cycles of 1 minute duration, pump-induced liquefaction, followed by 1 minute of settling (no moving water). The results were virtually identical on each and every cycle – to the point that it was boring, it was so predictable. It did not produce anything I would call layers, but did definitely (and very, very rapidly) destroy the very definite layers I had inadvertantly produced!
I did run a few long-period cycles with the piston being operated simultaneously, both during liquefaction and settling cycles. The pumping action had no visible effect, except to flex the 1/2″ acrylic walls in and out. To be honest, I did not expect the pressure differential to accomplish much. The flexing was enough that it was producing more of an effect than the pressure difference; so the piston action was abandoned.
In the end, the results were the same, no matter what. If we ran the pump any longer than 30 seconds, no change was noted, and no layers were recovered.
There has been some question of flow rates, and this is part of future research. Flow rates will be controlled very accurately, but I strongly suspect this will make no difference on the final outcome except the time required to produce the same results.
Introducing a heresy:
Andrew and I both share a simliar skepticism for the metamorphic interpretation of gneises and schists, and after examining the Llano granite uplift, we both came to the same conclusion: It’s a giant, sedimentary rock dome. I know for myself, I believe granite simply has a supernatural origin – there is no natural way to produce it. Contrary to common belief, it is impossible to form it from a melt. This has been borne out both in the lab in and in nature. While Andrew and I both agree that the granite batholith was a sedimentary rock, it’s formation still requires previously existing granites! It is granite that has simply been crushed up, transported, and relithified elsewhere. This is a continuing research which I will not discuss here.
One thing I personally noted with the liquefaction sediments was a stark resemblance to schist, gneiss and granitic outcrops I’ve examined in so many different places: They have stratification, but it’s a disordered mess, in the midst of giant plumes. This is precisely what we saw, on a small scale, in the liquefaction tank.
The liquefaction went through several distinguishable phases: Plumes, which brought lower layers through to the top, which caused a tilting of the upper layers downward. This led to “boiling” where all of the layers would eventually go to vertical or near vertical, followed by collapse of all of the structures, including the plumes. I have seen all of these stages within the rock record, namely in the “basement” rocks.
While I cannot be dogmatic on this, it appears as though the granite plume now known as the Llano uplift, was precisely that: A plume. However, it was not formed by a melt (as is conventionally believed), as that is impossible – so it must have been formed “cold” or at lower temperature. I am suggesting that water, supersaturated with silica, produced a liquefaction plume of granitic gravels. The silica precipitated out of the water, cementing the granite gravels into sedimentary granites. The cementing silica (quartz) appears to simply be a part of the granite, as quartz is one of the three main constituents of granite.
Andrew and I were supposed to perform considerable research into silica supersaturation and sedimentary cementation while at Glen Rose, however we simply ran out of time. Andrew has pointed out some processes which are now known which greatly simplify silica super-solubility, even in room termperature water. This may play a major role in explaining the massive beds of silica-cemented sediments around the world.
Conclusions to liquefaction:
Liquefaction doesn’t produce layers, it destroys them. However, it may very well be the father of plumes (such as those seen at Kodachrome basin) and the presumed metamorphic rocks referred to as the gneiss and schists so common throughout the Canadian Shield and in the bottom of the Grand Canyon. Some granites and granite “dykes” within these rocks may also very well be simply the cemented sediments from a liquefaction event – layers that were tipped up during the liquefaction process and solidifed before liquefaction destroyed all of the structures.
Addendum, February 2011:
Dr. Walter T. Brown has expressed disagreement with my conclusions on this page, specifically regarding liquefaction. He claims that what we acheived with “Archimedes” was not liquefaction, but rather disruption. Dr. Brown has a rather large chapter of his book devoted to liquefaction here: http://www.creationscience.com/onlinebook/Liquefaction.html
One of our researchers, Professor M.E. Clark, had built a reproduction of Dr. Brown’s liquefaction apparatus (shown here, figure 94), but was unable to replicate Brown’s results. It was actually this failure to reproduce results that led to the design and construction of Archimedes, but Dr. Brown has contended that there was an error in Clark’s methodology and/or construction of the apparatus.
I do have to agree with at least some of Brown’s criticisms, though during our research there were considerably more applicable observations which I did not report here. These other observations, as well as Dr. Brown’s critique have raised questions which I’m convinced will lead to more exciting discoveries, but to date, we have not been able to get back to the liquefaction research.
Sadly, after a year of battling cancer, Professor Clark passed away in December of 2010.
References and footnotes:
1) M. E. Clark and H. D. Voss, Resonance and Sedimentary Layering in the Context of a Global Flood, Proceedings of the Second International Conference on Creationism, R. E. Walsh and C. L. Brooks, Editors, 1991, Creation Science Fellowship, Inc., Pittsburgh, PA, Vol. 2, pp. 53-63.
by Ian Juby | Apr 1, 2015 | Uncategorized
Neanderthal Pages:
Page 103:
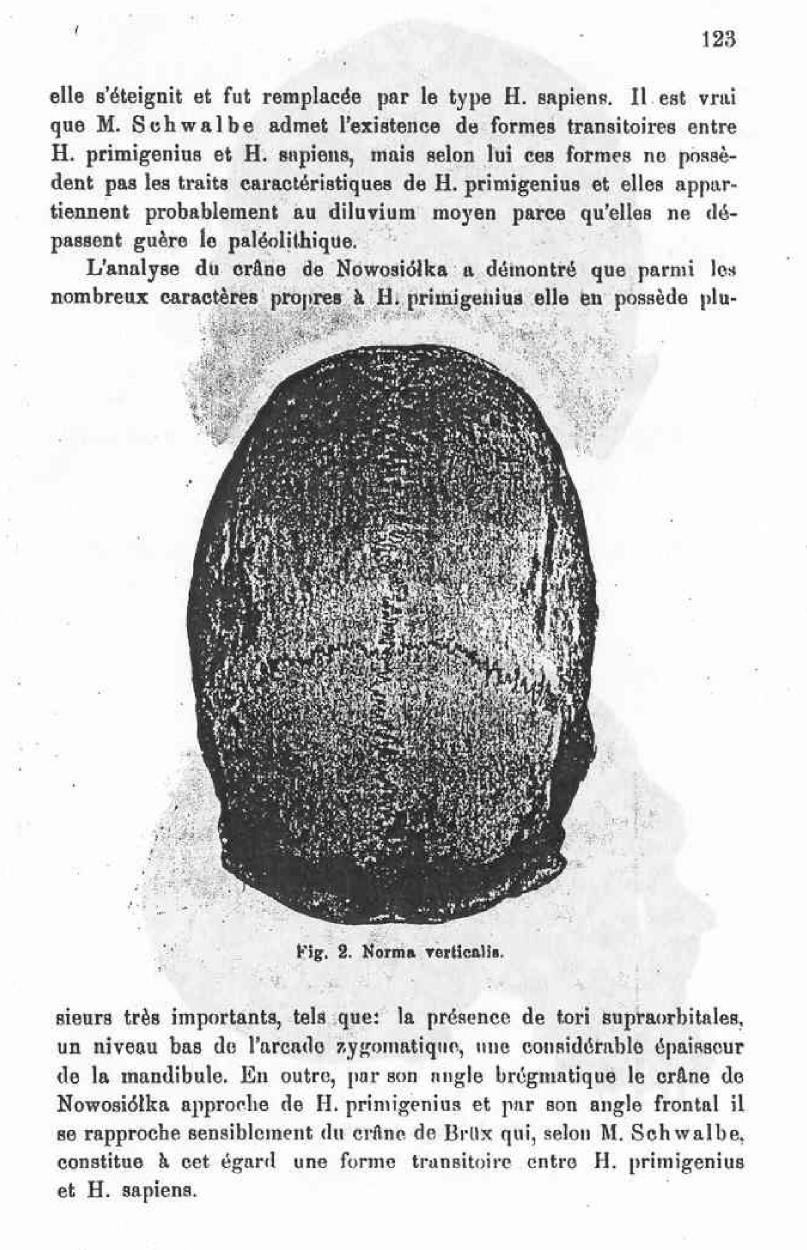
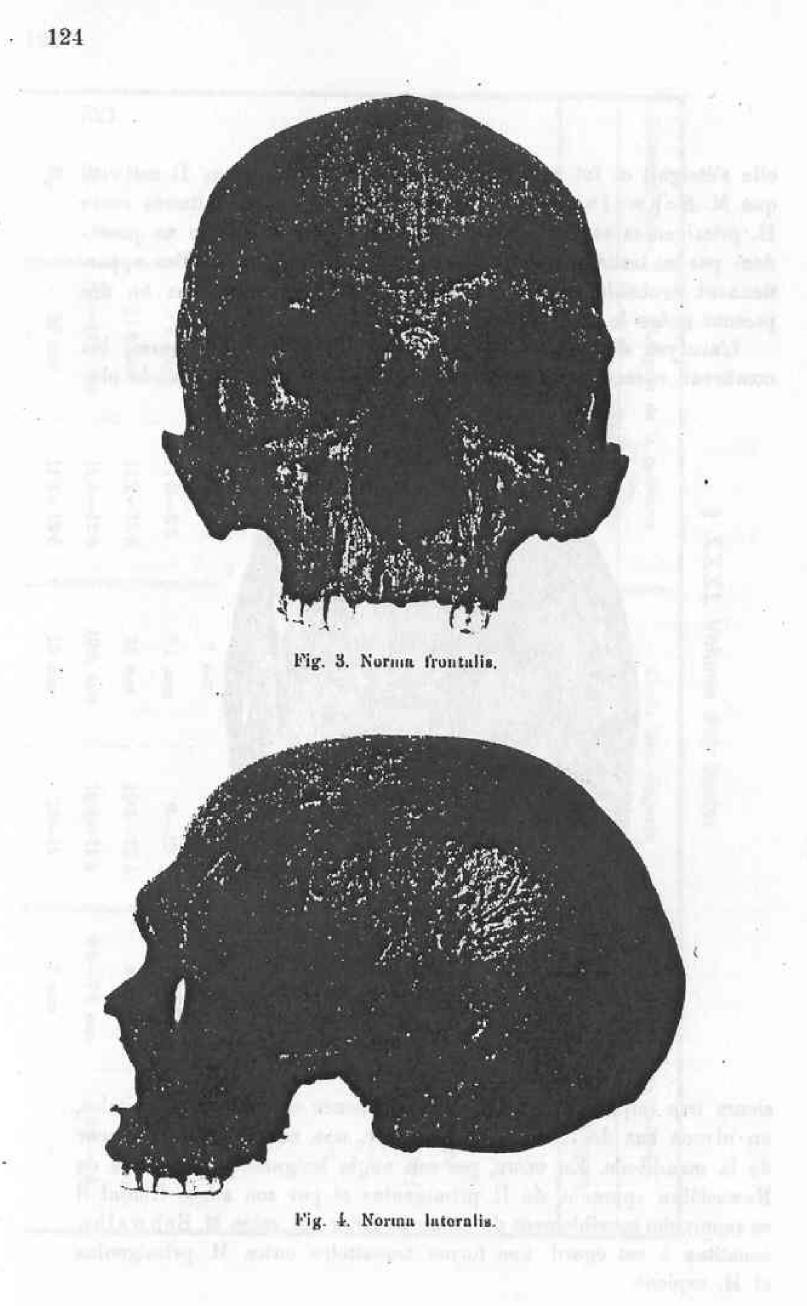
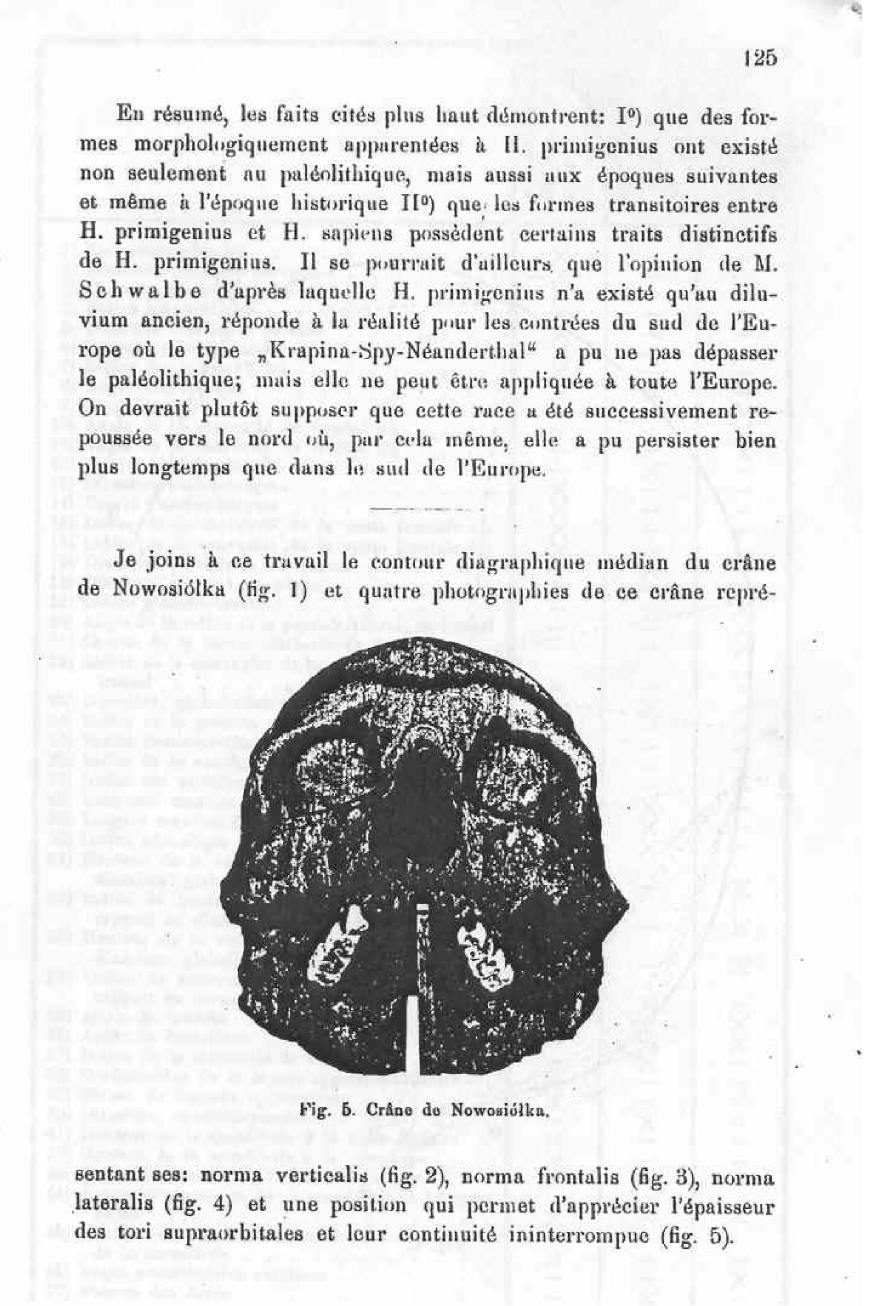
The Nowosiolka skull considered as a proof of the existence in recent history of forms belonging to H. primigenius.
Memoir of M. Kaimierz Stoly who presented by M. H. Hoyer on the 7th of January 1908.
During the last several years I published several works concerning the existence, in Poland, of a Spy-Neanderthaloid type. These works attracted the attracted the attention of the professor G. Schwalbe, seeing as the subject contradicted several of his opinions. According to Mr. Schwalbe, the Spy-Neanderthal race existed only in the ancient deluvian period, after which it went extinct, as well as the transitional forms between H. primigenius and H. sapiens did not go beyond the Paleolithic. To the contrary, I was of the opinion that the Spy-Neanderthaloid types, having a softer Neanderthal-type structure, existed not only in the ancient deluvian, but also in the later prehistoric periods and can be observed even in the historic period. Of course, there is no question of the existence beyond the Paleolithic of a pure Spy-Neanderthal type, exactly the same as the bones of Neanderthal, the Spy, and to a lesser degree, the bones of the Krapina; it consists only of the existence beyond the ancient deluvian of human bones having a structure that resembles that of the Spy-Neanderthal type, although a lot more delicate than this and even changed in some aspects thanks to the influence of the environment and growth. Mr. Schwalbe found that this way of looking at things was wrong and submitted a critique to the German Anthropological Congress of 1905, also in a memoir that appeared in the Zeitschrift f. Morphologie u. Anthropologie J. 1906. I’ve also been honored to write several letters on the subject. To solve the problems in question, I have submitted the materials previously studied to a new examination; my previous research, not being in the manner of the methods of Mr. Schwalbe did not permit comparison between my skulls and those which were considered by Misters Schwalbe, Klaatsch and Gorjanowie-Kramberger as representatives of the Spy-Neanderthal race. I started by studying use the method of Mr. Schwalbe the “scythic” cranium of Nowosiolka; it’s my opinion that it is the one amongst all the skulls to be found at the Anthropological laboratory of Varsovie that contains the characteristics the most representative of the Spy-Neanderthal race.
We have found archaeological facts concerning the skull in question in a memoir of Mr. Bydlowski “the Kourghans of Nowosiolka of the district of Lipowiec, Government of Kiev” (Swiatowit t. V. 1904); the kourghan from where the skull came is designated as number V. The skull of Nowosiolka must have belonged to a man that was thirty years old; concerning the period from which he came, we can determine this from the objects that were found with him in the tomb. Beside the skeleton, which was lying on his back, the head towards the west, was found a suit of armour complete with iron plates held together by rivets. On the other side were found two long spear points of which one had a flat side, the other was forged in a quadrangular bar. At the feet of the skeleton was a yellow clay goblet with a handle of ornate work, bordered on the inside with a black band; two parallel bands went around the inside of the goblet at the top. Beside the goblet was found a beautiful red clay amphora (antique vase) of conical shape, the bottom shaped obliquely. At the feet and the head of the dead were found two horse skeletons with the harness bridles and four bits the same as those that are used today. Concerning the harness we found only bits of leather and green and oxidized metal ornaments.
The present memoire is solely dedicated to the study of the position that the Nowosiolka skull when compared to the H. primigenius group, which includes the skulls of Neanderthal, of Spy and of Krapina, and also taking into consideration other diluvian skulls. I will not concern myself with the question of the relationship between H. primigenius and H. sapiens, nor of the problem of where the limit is to be marked between these two groups.
- Tori supraorbitales. I start with this characteristic, recognized as pithicoidal and having, according to M. Schwalbe the most importance as a distinctive trait of the Spy-Neanderthal type. M. Schwalbe affirms that all developed eyebrows cannot be considered as a sufficient enough characteristic to classify a skull amoung the representatives of the Spy-Neanderthal type; The indispensable condition is that the eyebrow protrusion must follow the borders of the entire orbital (eye sockets), with the exception of a slight depression which can be found on the median plane. M. Schwalbe calls these protrusions tori supraorbitales and considers them, the same as M. Klaatsch and M. Gorjanowie-Kramberger, as the most important characteristic amoung the Spy-Neaderthal race. Concerning H. Sapiens, we may sometimes find, according to M. Schwalbe, pronounced eyebrows but which instead of following the complete orbit to the joint of the frontal and cheek bones, hardly get to the middle after which they go obliquely straight up. There exists in H. sapiens, in the lateral part of the orbital, in a trilateral plane or even of a small depression that extends from the middle of the upper edge of the orbitals to where they meet the cheek bone. The lateral plane in question is called by M. Schwalbe planum supraorbitale. For M. Klaatsch and M. Gorjanowie-Kramberger and M. Schwalbe, the protrusion of the lateral part of the eyebrows never happens in modern skulls.According to M. Gorjanowie-Kramberger, the sus-orbital cut (indentation) in the case in question is an important morphological characteristic. According to this author, Neolithic skulls and skulls belonging to recent H. sapiens types present a sus-orbital cut sometimes very deep of which the lateral edge defines the sus-orbital protuberance. Contrarily, the skulls belonging to the H. primigenius type have only a very weak protuberance and laterally a small oblong extension. In addition, the sus-orbital protuberance ordinarily gives birth to a very flat “gutter” which, laterally and obliquely directed, transverses the torus supraobrbitalis and consists of the first developmental stage of the sus-orbital line, that is to say the first degree of separation of the sus-orbital prominences; they are continuous in H. primigenius, but are completely separate in H. sapiens. However, concerning tori and incisorae supraorbitales, M. Gorjanowie-Kramberger recognizes the existence of transitional types between H. primigenius and H. sapiens and cites as an example of the gradual disappearance of the tori, the Néolithic Babsk skull.In studying the Nowosiolka skull, I was careful to take into consideration the opinions that I just cited. My research has demonstrated that 1. the skull in question has extended eyebrows that follow the complete ridge of the orbitals until they reach the cheek bones; this corresponds exactly to the characteristic structure of H. primigenius; 2. that the sus-orbital cuts are greatly developed but the gutters which go off in a obliquely lateral direction are so weak and so shallow that they do not interrupt the continuity of the tori supraorbitales. We can observe similar relationships with the Krapina skull where the gutters are very flat presenting the first degree of separation of the tori supraorbitales in arcus supraciliaris and margo supraorbitales. According to M. Gorjanowie-Kramberger this cranial structure of Krapina is evidence in favor of the existence of recent transitional forms between H. primigenius and H. sapiens. To determine more exactly the thickness of the tore orbitales of the Nowosiolka skull, I measured them and give here the results of these measurements adding also the results found by M. Gorjanowie-Kramberger concerning the tori supraorbitales of several skulls from Krapina.
(see table on page 107)
| Skulls |
Median edge |
Point of the least thickness |
Lateral edge |
| Neanderthal from the right |
20 mm |
12 mm |
12 mm |
| Neanderthal from the left |
20 mm |
13 mm |
13 mm |
| Nowosiolka from the right |
16 mm |
8 mm |
9 mm |
| Nowosiolda from the left |
16 mm |
7 mm |
10 mm |
| Krapina C |
13.8 mm |
9.5 mm |
12.1 mm |
| Krapina D |
11.9 mm |
9.3 mm |
11.5 mm |
| Krapina fragment |
|
9 mm |
|
| Another Krapina fragment |
|
4 mm |
|
This table shows that the thickness of the eyebrows of the Nowosiolka skull is very close to that of the Krapina skulls. It is true that the lateral part of the eyebrows are a little less thick than their equivalents in the Krapina skulls (with the exception of one of the fragments) but, in return, the median parts are thicker. In short, the eyebrows of the Nowosiolka skull, thanks to their non-interrupted continuity to the frontal-cheek suture, also in considering their thickness can be designated as tori supraorbitales and not as arcus supraciliaris, as is also recognized by M. Schwalbe based upon a photograph that I had the honour of sending him.
Concerning the eyebrows, the Nowosiolka skull is quite different from the H. sapiens type and can be joined to the Spy-Neanderthal-Krapina group.
- Interorbital index. [dakryon-dakryon x 100 / internal biorbit. diameter] (dacryon)Interorbital diameter (dakryon-dakryon) (dacryon)
| Spy I skull |
32 mm |
Krapina C skull |
20 mm |
| Brüx skull |
31 mm |
Krapina fragment |
28 mm |
| Neanderthal skull |
30 mm |
Cannstadt skull |
26.2 mm |
| Nowosiolka skull |
30 mm |
Gibraltar skull |
20 mm |
The interorbital diameter of the Nowosiolka skull does therefore not go beyond the dimensions of H. primigenius.
Diameter of the interal biorbital:
| Spy I |
116-113 mm |
Krapina C |
107 mm |
| Neanderthal |
112 mm |
Krapina fragment |
106 mm |
| Nowosiolka |
110 mm |
Brüx skull |
104 mm |
The biorbital diameter of the Nowosiolka skull does therefore not go beyond the dimensions of H. primigenius.
Interorbital index:
| Brüx |
29.8 |
Krapina C |
27.1 |
| Spy I |
29-28 |
Neanderthal |
27 |
| Nowosiolka |
27.27 |
Krapina fragment |
26.4 |
The interorbital index of the Nowosiolka skull does therefore not go beyond the dimensions of H. primigenius.
III. Frontal-biorbital index [frontal minima width x 100 / external biorbital diameter]
Diameter of the external biorbital:
| Krapina D |
126.2 mm |
Spy I |
123 mm |
| Neanderthal |
126 mm |
Nowosiolka |
122 mm |
| Krapina fragment |
126 mm |
Krapina C |
118 mm |
| Spy II |
124 mm |
Pithecanthropus |
106 mm |
The external biorbital diameter of the Nowosiolka skull does therefore not go beyond the dimensions of H. primigenius.
Frontal minima width:
| Krapina D |
100.4 mm |
Tilbury |
101 mm |
| Spy II |
109 mm |
Krapina C |
98.5 mm |
| Neanderthal |
107.5 mm |
Podbaby |
98 mm |
| Nowosiolka |
104 mm |
Cannstadt |
96 mm |
| Spy I |
104 mm |
Gibraltar |
95 mm |
| Krapina fragment |
104 mm |
Brüx |
92 mm |
| Sligo |
102 mm |
Pithecanthropus |
87 mm |
The frontal minima width of the Nowosiolka skull does therefore not go beyond the dimensions of H. primigenius.
Frontal biorbital index
| Neanderthal |
88.8 |
Spy I |
84.5 |
| Spy II |
87.9 |
Krapina C |
83.4 |
| Krapina D |
87.3 |
Krapina fragment |
82.5 |
| Nowosiolka |
85.25 |
Pithecanthropus |
82 |
The frontal biorbital index of the Nowosiolka skull does therefore not go beyond the dimensions of H. primigenius.
- Bregmatic angle
| Cannstadt |
60 |
Brüx |
51.5 – 45.5 |
| Brünn |
54 |
Spy II |
50.5 |
| Nowosiolka |
53.5 |
Krapina D |
50 |
| Krapina C |
52 |
Spy I |
46 |
| Galley-Hill |
52 |
Neanderthal |
44 |
| Gibraltar |
51 – 50 |
Pithecanthropus |
37.5 |
The brgmatic angle of the Nowosiolka skull is close to that of H. primigenius.
- Frontal angle (m. g. i.):
| Cannstadt |
90 |
Spy II |
70 |
| Galley-Hill |
82 |
Krapina C |
70 |
| Nowosiolka |
78 * |
Krapina D |
65 |
| Brüx |
77 – 72.5 |
Neanderthal |
62 |
| Brünn |
75 |
Spy I |
59 |
| Gibraltar |
74 – 73 |
Pithecanthropus |
52.5 |
The frontal angle of the Nowosiolka skull differs from that of H. primigenius. However, it is to be noted that closeness of this measurement with the Brüx skull which is considered by M. Schwalbe, in terms of the frontal angle measurements as being transitional between H. primigenius and H. sapiens.
- Angle of frontal convexity (Angle A) (n. r. b.)
| Spy I |
151 |
Cannstadt |
135 |
| Pithecanthropus |
146.25 |
Nowosiolka |
131 |
| Spy II |
141.5 |
Brüx |
131 |
| Neanderthal |
139 |
|
|
The angle (n. r. b.) of the Nowosiolka skull differs from those of H. primigenius.
Angle B (g. e. b.)
This angle is more important than the last one by which the opening is dependant, to a certain degree, of the position more of less depressed of the nasal opening.
| Spy I |
159 |
Neanderthal |
150 |
| Pithecanthropus |
153.2 |
Nowosiolka |
139 |
| Spy |
151 |
Krapina A (child) |
134 |
The angle (g. e. b.) of the Nowosiolka skull differs from those of H. primigenius.
VII. Angle: lambda – glabella – inion (l. g. i.)
| Nowosiolka |
18 |
Brünn |
17 |
| Krapina C |
17 |
Spy II |
16.5 |
| Brüx |
17 |
Spy I |
16 |
| Galley-Hill |
17 |
Neanderthal |
15 |
The angle lambda – glabella – inion of the Nowosiolka skull is close to that of H. primigenius.
VIII. Convex index of the frontal arch
A: [diameter: nasal-bregma x 100 / curve: nasal-bregma]
Diameter: nasal-bregma
| Neanderthal |
119 mm |
Brüx |
115 mm |
| Cannstadt |
117 mm |
Egisheim |
115 mm |
| Nowosiolka |
116 mm |
Pithecanthropus |
112-96 mm |
| Spy II |
115 mm |
Spy I |
108 mm |
The diameter of the nasal-bragma of the Nowosiolka skull is within the range of H. primigenius. bregma
Nasal-bregma curve
| Cannstadt |
135 mm |
Egisheim |
130 mm |
| Brüx |
135 mm |
Spy II |
124 mm |
| Neanderthal |
133 mm |
Pithecanthropus |
120 – 100 mm |
| Nowosiolka |
132 mm |
Spy I |
115 mm |
The nasal-bregma curve of the Nowosiolka skull is within the range of H. primigenius.
Index A) of the convexity of the frontal arch:
| Pithecanthropus |
94.6 |
Nowosiolka |
87.22 |
| Spy I |
93.9 |
Neanderthal |
87.2 |
| Spy II |
92.7 |
Cannstadt |
86.67 |
| Egisheim |
88.5 |
Brüx |
85.1 |
The index A) of the convexity of the frontal arch of the Nowosiolka skull is within the range of H. primigenius.
Index of the convexity of the frontal arch
B): [diameter: glabella-bregma x 100 / curve: glabella-bregma]
This index is more important than the one before by which the size depends, to a certain degree, to the position more or less depressed of the nasal cavity; in the case of deep concavity at the base of the nose the median curve of the front gains in length; however this is not an equivalent of the growth of the convexity of the frontal arch.
| Spy-Neanderthal |
93.8 – 89.4 |
| Nowosiolka |
92.8 |
| Krapina A (child) |
90.3 |
The index of the convexity of the frontal arch of the Nowosiolka skull does not go beyond the range of H. primigenius. It is also to be noticed that the Nowosiolka skull contains a persistent frontal suture for most of it’s length, and that the light bulges that accompany each side contribute to produce the effect of convexity fo the frontal arch when seen on the photograph of the skull in question in it’s norma lateralis.
- Glabello – cerebral index[diameter: frontal glabello x 100 / diameter frontal cerebral]Diameter of the frontal glabello:
| Neanderthal |
38 mm |
Nowosiolka |
25 mm |
| Gibraltar |
36 mm |
Pithecanthropus |
24 mm |
| Spy I |
32 mm |
Galley-Hill |
24 mm |
| Spy II |
30 mm |
Brüx |
24 mm |
| Brünn |
30 mm |
Cannstadt |
13 mm |
| Krapina C |
28.2 mm |
|
|
The frontal glabella diameter of the Nowosiolka skull is close to those of H. primigenius.
Diameter of the frontal cerebral
| Cannstadt |
104 mm |
Pithecanthropus |
80 – 95 mm |
| Brüx |
99 mm |
Neanderthal |
86 mm |
| Nowosiolka |
99 mm |
Krapina C |
86 mm |
| Brünn |
96 mm |
Gibraltar |
82 mm |
| Galley-Hill |
95 mm |
Spy I |
81 mm |
| Spy II |
92 mm |
|
|
The diameter of the frontal cerebral of the Nowosiolka skull differs from those of H. primigenius.
Glabello-cerebral index
| Neanderthal |
44.2 |
Egisheim |
29 |
| Gibraltar |
43 |
Pithecanthropus |
27.6 |
| Spy I |
41.5 – 40.9 |
Nowosiolka |
25-26 |
| Spy II |
34.4 |
Galley-Hill |
25.2 |
| Krapina C |
32 |
Brüx |
24.24 |
| Brünn |
31.2 |
Cannstadt |
18.2 |
The glabello-cerebral index of the Nowosoilka skull is beyond the range of H. primigenius. M. Schwalbe came to the conclusion that this index is very important and that it permits us to mark a limit between the H. primigenius and H. sapiens groups which are to date not linked by the existence of any intermediate form. However, the table below shows that the skulls of Brünn, of Egisheim and even that of Pithecanthropus consist of similar transitional forms. This fact is all the more remarkable when we consider that M. Schwalbe does not put aside the possibility of genetic development of Pithanthropus and H. primigenius. In this hypothesis, we would have to wait until Pithecanthropus develops precisely this distinctive and important trait to a degree as pronounced as H. primigenius. The previous table proves the contrary. The two facts mentioned above: the existence of intermediate forms and the reality that Pithecanthropus is of such form concerning the glabello-cerebral index, considerably diminishes the value that M. Schwalbe attributes to the index in question.
- Angle of the protrusion of the part of the frontal cerebral (a. t. h.)
| Spy I |
155.5 |
Spy II |
147 |
| Pithecanthropus |
154.5 |
Brüx |
143.5 |
| Neanderthal |
151 |
Nowosiolka |
139 |
The angle in question for the Nowosiolka skull differs from that of H. primigenius. The small size of this angle of the Nowosiolka skull must certainly have as a cause the median convexity of the frontal produced by the persistence of the frontal suture.
- Index of the convexity of the cerebral part of the frontal[diameter of the cerebral part x 100 /curve of the cerebral part]
Curve of the cerebral part of the frontal
| Cannstadt |
113 mm |
Neanderthal |
95 mm |
| Brüx |
105 mm |
Pithecanthropus |
98 – 78 mm |
| Nowosiolka |
105 mm |
Spy I |
88 mm |
| Spy II |
100 mm |
|
|
The curve of the cerebral part of the frontal of the Nowosiolka skull differs from those of H. primigenius.
Index of the convexity of the cerebral part:
| Spy I |
97.5 |
Nowosiolka |
92.38 |
| Pithecanthropus |
96.1 |
Cannstadt |
92.04 |
| Neanderthal |
95.5 |
Spy II |
92.0 |
| Brüx |
94.29 |
|
|
This index for the Nowosiolka skull is within the range of H. primigenius.
XII. Index of the position of the bregma
[diameter g. w. x 100 / diameter glabella-inion]
Diameter glabella-inion
| Galley-Hill |
204 mm |
Nowosiolka |
194 mm |
| Brünn |
201 mm |
Gibraltar |
187 mm |
| Neanderthal |
199 mm |
Brüx |
186-180 mm |
| Spy I |
198 mm |
Pithecanthropus |
181 mm |
| Krapina D |
197.5 mm |
Cannstadt |
174 mm |
| Spy II |
196 mm |
|
|
The glabella-inion diameter of the Nowosiolka skull is close to that of H. primigenius.
Index of the position of the bregma
| Pithecanthropus |
44.1 |
Spy II |
35.2 |
| Neanderthal |
38.4 |
Spy I |
34.8 |
| Nowosiolka |
35.56 |
Krapina D |
31.8 |
The index of the position of the bregma is within the range of H. primigenius.
XIII. Fronto-parietal index
[minima width of front x 100 / maxima width of front]
| Neanderthal |
73.1 |
Brüx |
71-68 |
| Krapina A |
72.5 |
Krapina C |
66.4 |
| Nowosiolka |
72.22 |
Cannstadt |
65.7 |
| Tilbury |
72.1 |
Pithecanthropus |
65.4 |
| Spy I |
71.2 |
Gibraltar |
64.2 |
| Spy II |
71.2 |
Egisheim |
61.3 |
The fronto-parietal index of the Nowosiolka skull is within the range of H. primigenius.
XIV. Index of the convexity of the parietals
[diameter of the sagittal suture x 100 / curve of the sagittal suture]
| Neanderthal |
94.5 |
Nowosiolka |
91.18 |
| Krapina D |
92.8 |
Krapina (adult) |
86.3 |
This index for the Nowosiolka skull is within the range of H. primigenius.
- Index of the parietals
[sagittal curve of the parietals x 100 / sagittal curve of the front]
| Spy I |
104.3 |
Brüx |
92.6 |
| Nowosiolka |
102.26 |
Neanderthal |
89.4-82.7 |
| Spy II |
96.7 |
Pithecanthropus |
85.8 |
| Egisheim |
95.3 |
|
|
The index of the parietals are within the range of H. primigenius.
XVI. Cephalic index
[maxima width of the skull x 100 / maxima length of the skull]
| Galley-Hill |
205 mm |
Brüx |
195-190 mm |
| Brünn |
204 mm |
Gibraltar |
192.5-190 mm |
| Nowosiolka |
200 mm |
Pithecanthropus |
181 mm |
| Neanderthal |
199 mm |
Krapina C |
178 mm |
| Spy II |
198 mm |
Cannstadt |
178 mm |
| Krapina D |
197.5 mm |
|
|
The maxima length of the Nowosiolka skull is close to that of H. primigenius.
Maxima width (euryon – euryon)
| Krapina D |
169 mm |
Tilbury |
140 mm |
| Krapina C |
149 mm |
Brünn |
139 mm |
| Gribraltar |
148 mm |
Brüx |
135-130 mm |
| Neanderthal |
147 mm |
Pithecanthropus |
133 mm |
| Cannstadt |
146 mm |
Galley-Hill |
130mm |
| Nowosiolka |
144 mm |
|
|
The maxima width of the Nowosiolka skull is close to the range of H.primigenius.
Cephalic index:
| Krapina D |
85.5 |
Pithecanthropus |
73.4 |
| Krapina C |
83.7 |
Spy I |
72.2 |
| Cannstadt |
82 |
Nowosiolka |
72 |
| Gibraltar |
77.9 |
Brüx |
69 |
| Spy II |
77.2 |
Brünn |
68.2 |
| Neanderthal |
73.9 |
Galley-Hill |
63.4 |
The cephalic index of the Howosiolka skull is close to that of H. primigenius.
XVII. Height of the cranial arch in relationship to the glabella-inion diameter (Kalottenhöbe)
| Cannstadt |
105 mm |
Gibraltar |
85 mm |
| Nowosiolks |
104 mm |
Neanderthal |
81-80.5 mm |
| Brünn |
103 mm |
Krapina D |
83.5 mm |
| Galley-Hill |
97 mm |
Krapina C |
82 mm |
| Brüx |
92-85 mm |
Spy I |
81 mm |
| Spy II |
87 mm |
Pithecanthropus |
62 mm |
The height of the cranial arch in relationship with the glabella-inion diameter of the Nowosiolka skull differs from that of H. primigenius.
XVIII. Index of the height of the cranial arch in relationship to the glabella-inion (Kalottenhöbe index)
[diameter c. h. (cranial arch height) x 100 / diameter: glabella-inion]
| Cannstadt |
60.34 – 58.99 |
Gibraltar |
45.4 |
| Egisheim |
55.5 |
Spy II |
44.3 |
| Nowosiolka |
53.61 |
Krapina D |
42.2 |
| Brünn |
51.2 |
Spy I |
40.9 |
| Brüx |
51.1-47.6 |
Neanderthal |
40.5 |
| Galley-Hill |
48.2 |
Pithecanthropus |
34.2 |
| Krapina C |
46 |
|
|
This index of the Nowosiolka skull is outside the range of H. primigenius.
XIX. The height of the cranial arch in relationship with the glabella-lambda diameter (Lambda-Kalottenhöbe)
| Cannstadt |
75 mm |
Neanderthal |
57-54.5 mm |
| Egisheim |
70 mm |
Brüx |
56 mm |
| Nowosiolka |
66 mm |
Krapina D |
53 mm |
| Spy II |
58 mm |
Spy I |
51 mm |
The height of the cranial arch in relationship with the glabella-lambda diameter of the Nowosiolka skull differs from the that of H. primigenius.
- Index of the height of the cranial arch in relationship with the glabella-lambda diameter
[diameter k. p. (height of the cranial arch) x 100 / glabella-lambda diameter]
| Cannstadt |
43.3-42.1 |
Brüx |
30.2 |
| Egisheim |
37.8 |
Neanderthal |
29.4 |
| Nowosiolka |
34.02 |
Krapina D |
29.3 |
| Spy II |
31.3 |
Spy I |
27.4 |
This index of the height of the cranial arch of the Nowosiolka skull is close to that of H. primigenius.
XXI. Lambda angle (l. g. i.)
| Nowosiolka |
82 |
Gibraltar |
73 – 69 |
| Brünn |
78 |
Neanderthal |
66.5 |
| Krapina C |
76 |
Krapina D |
65 |
| Galley-Hill |
71 |
|
|
The lambda angle of the Nowosiolka skull differs from that of H. primigineius.
XXII. The angle of the opisthion (o. i. g.)
| Krapina D |
57 |
Galley-Hill |
42 |
| Neanderthal |
51.3 |
Nowosiolka |
36 |
| Brünn |
42 |
Gibraltar |
36 |
The angle of the opsthion of the Nowosiolka skull differs from that of H. primigeius.
XXIII. Occipital convexity index
[diameter: lambda-opisthion x 100 / curve: lambda-inion-opisthion]
| Nowosiolka |
81.45 |
| Krapina B |
80.4 |
| Other Krapina |
77 |
The occipital convexity index is close to that of H. primigenius.
XXIV. Configuration of the zygomatico-maxilla.
According to M. Garjonowie-Kramberger, the zygomatico-maxilla suture of the Krapina C skull has a different configuration from that observed on recent H. sapiens skulls. The sub-orbital part of the cheek bone of the skull in question doesn’t extend as far towards the nose and is not as receded as modern and Neolithic European skulls. The result is that the zygomatico-maxilla suture of this skull goes vertically down and then turns towards the back. This configuration is related to the considerable development of the sub-orbital part of the maximilla which normally brings about the absence of canine dimples. However, with the Nowosiolka skull, the configuration of the zygomatico-maxilla suture is similar to that of the Krapina skull; the canine dimples are also missing. Therefore, it can be said that the configuration of the zygomatico-maxilla of the Nowosiolka skull does not differ from the same structure of H. primigenius.
XXV. The level of the zygomatic eyebrow. The position of the zygomatic eyebrow in relationship with the german horizontal constitutes according to M. Garjonowie-Kramberger an important morphological trait. In recent H. Sapiens, the eyebrows in question extend ordinarily either above the horizontal plane, either at the same level and only on rare occasions will it be found below this plane. With the Krapina C skull, on the temporal part of the zygomatic eyebrow starts at the level of the german horizontal plane but then lowers so much that the anterior upper edge of the cheekbone apophysis is found below the plane in question. M. Fairpont and Klaatsch think that a configuration like this existed on the Spy I skull. A similar structre can be found in several anthropoids: the gorilla and the chimpanzee. On the Nowosiolka skull the structure is exactly the same as that described on the Krapina C skull. Therefore, in terms of the zygomatic eyebrow on the Nowosiolka skull it is not different that that found in H. primigenius.
XXVI. Akanthion-prosthion diameter
| Spy I |
28 mm |
Krapina C |
21 mm |
| Krapina E |
27.7 mm |
Nowosiolka |
18 mm |
| Krapina F |
24.7 mm |
|
|
The akantion-prosthion diameter is close to that of H. primigenius.
XXVII. Height of the inferior jaw index
[height of the jaw at the 2-me molar x 100 / height of the jaw at the symphysis]
Height of the jaw at the 2-me molar:
| Krapina H |
34.3-33 mm |
Krapina B |
25 mm |
| Spy I |
33 mm |
Krapina E |
24.1 mm |
| Krapina I |
32.2 mm |
Arcy |
24 mm |
| Krapina D |
29 mm |
La-Naulette |
23 mm |
| Nowosiolka |
28 mm |
Mularnaud |
22 mm |
| Krapina G |
27.5 mm |
Krpaina C |
20 mm |
| Krapina F |
27.4 mm |
|
|
The height of the jaw at the 2-me molar is within the range of H. primigenius
The height of the jaw at the symphysis
| Krapina I |
42.3 mm |
Krapina F |
31 mm |
| Krapina H |
40 mm |
La-Naulette |
31 mm |
| Spy I |
38 mm |
Krapina C |
29-28.5 mm |
| Nowosiolka |
35 mm |
D’Arcy |
28 mm |
| Krapina E |
35 mm |
Malarnaud |
26 mm |
| Krapina D |
33-30.5 mm |
Krapina B (child) |
25.3 mm |
| Krapina G |
31.5-30.4 mm |
|
|
The height of the jaw at the symphysis is within the range of H. primigenius.
According to M. Gorjanowie-Kramberger, the inferior jaw of H. primigenius is noticeable due to the considerable height of the jaw at the symphysis; numerous diluvian skulls also have some height at the symphysis that goes beyond the upper molar. M. Gorjanowie-Kramberger considers that when a similar structure is seen in recent H. sapiens, it is an atavic variation. This exists also on the Nowosiolka skull.
Index of the height of the inferior jaw:
| Krapina G |
92.1-88.8 mm |
Malarnaud |
84.6 mm |
| Spy I |
86.8 mm |
Nowosiolka |
80 mm |
| D’Arcy |
85.7 mm |
La-Naulette |
74.19 mm |
| Krapina H |
85.7 mm |
Krapina I |
71.3 mm |
| Krapina B |
84.8 mm |
Krapina E |
68.8 mm |
The inferior jaw height index is within the range of H. primigenius.
XXVIII. Thickness of the main part of the symphysis of the lower jaw
| Krapina I |
74 mm |
Spy I |
68 mm |
| Krapina C |
70.4 mm |
Krapina H |
66.5 mm |
| Nowosiolka |
70 mm |
D’Ochos |
66 mm |
This distance on the Nowosiolka skull is within range of H. primigenius.
XXIX. Anterior mandible angle
| Krapina H |
106 |
Krapina D |
94 |
| Krapina G |
103.5 |
Krapina I |
94 |
| Krapina F |
102 |
La-naulette |
89 |
| Krapina C |
96.5 |
Spy I |
84.5 |
| Krapina E |
95 |
Nowosiolka |
68 |
The anterior mandible angle is not within the range of H. primigenius.
XXX. Teeth size
See table on page 120
The results from the table show that the Nowosiolka skull has some teeth of considerable size of which some correspond to the Krapina skull. We notice that in the case of the Nowosiolka skull a reduction in teeth size and a reduction in the whole dental system since the wisdom teeth have not yet appeared. Concerning the teeth size, the Nowosiolka skull approaches that of H. primigenius.
I present the results of my observations concerning the Nowosiolka skull in the following table on page 121
This table shows that, out of 47 characteristics studied, the Nowosiolka skull possesses 23 which are identical to that of H. primigenius, 11 that are close to that of H. primigenius and only 13 that differ from H. primigenius. These results prove that the Nowosiolka skull possesses in some aspects a structure as primitive as the H. primigenius type and permits us to establish a morphological link between this skull and those of Spy-Neanderthal-Krapina.
Not forgetting that the Nowosiolka skull does not belong to the ancient diluvian, nor the Paleolithic, but to recent history.
- Schwalbe affirms that the Spy Neanderthal race only existed on earth until the middle of the quarterly period, period when they became extinct and replaced by H. sapiens. It is true that M. Schwalbe admits the existence of transitional forms between H. primigenius and H. sapiens but according to him, these forms to not possess the characteristic traits of H. primigenius and they probably belong to the middle diluvian because they rarely go beyond the Paleolithic.
The analysis of the Nowosiolka skull has shown that it contains numerous characteristics which are only associated with H. primigenius. Several very important, such as the tori supraorbitalis, the low level of the zygomatic eyebrow, the considerable thickness of the mandible. Also, the Nowosiolka skull according to the bregmatic angle considerably approaches that of the Brüx skull, which according to M. Schwalbe, constitutes a transitional form between H. primigenius and H. sapiens.
In conclusion, the facts cited earlier demonstrate that 1. that morphological forms belonging to H. primigenius existed not only in the Paleolithic, but also later eras as well as recent history 2. that transitional forms between H. primigenius and H. sapiens contain distinctive traits that differ from H. primigenius. IT is possible that the opinion of M. Schwalbe, that H. primigenius existed only during the ancient diluvian is true only for regions in southern Europe where the Spy-Neanderthal-Krapina type did not live beyond the Paleolithic; but this can not be applied to all of Europe. We must assume that this race was progressively pushed towards the north, where by this fact, it could survive much more longer than in the south of Europe.
I attach to this work the medien diagraphic countour of the Nowosiolka skull (fig. 1) and four pictures of this skull representing it’s norma verticalis (fig 2), norma frontialis ( fig. 3), normal lateralis (fig. 4) and a position which permits the appreciation of the tori supraorbitalis and their uninterrupted continuum (fig 5).
I wish to express my sincere thanks to M. Schwalbe, L Kollmann, A. Rauber, and K. Maska who have made available several of their precious works. I thank also M. Z. Weyberg for the excellent reproductions of the Nowosiolka skull.
Anthropology Laboratory and Museum of Industry and Agriculture of Varsovie.
by Ian Juby | Apr 1, 2015 | Uncategorized
It has been brought to my attention that Mike Arehart in Idaho was the individual who found this original manuscript that so many have looked for for so long. Mike, I know I say “Thanks!” for a LOT of people – I’ve been very surprised by the interest this article has generated.
Because of copyright restrictions, only portions of the original manuscript are provided here until I pin down how much of the original I can present here. So, I chose the most pertinent pages.
Laurence Tisdall kindly translated the entire text which essentially starts on page 103.